Allan Vu is a Digital Marketing expert and the driving force behind BOGOS’s blog content. With a deep understanding of eCommerce and Shopify promotions, he is passionate about helping merchants unlock the full potential of their stores.
At BOGOS, Allan creates valuable, practical content focused on strategies like Free Gifts, Buy X Get Y, product bundles, and upsell offers to empower Shopify sellers to grow their businesses effectively.
Known for his clear, insightful writing, Allan is dedicated to delivering actionable advice that makes a real difference for BOGOS’s readers.
Running two or more Shopify stores gives you reach. It also gives you a reporting headache.
Every store lives in its own Shopify account, with its own login and its own reports. So when you want to know how the whole business is doing, you open each admin one by one and stitch the numbers together by hand.
This guide shows you how to see all your Shopify stores in one dashboard — combined and per store. You’ll learn why Shopify keeps this data separate, what a real multi-store view needs to show, and how to set one up in about five minutes.
It’s written for merchants running two or more Shopify stores who want a single, accurate picture of sales, customers, and products across every storefront.
TL;DR
Shopify treats each store as a separate account, so standard plans report one store at a time — separate stores never combine natively.
Shopify Plus adds organization-level multi-store analytics, but it’s Plus-only, focused on sales and orders, and leaves customer data siloed per store.
A true multi-store dashboard should show combined and per-store revenue, AOV, de-duplicated customers (LTV and RFM), products, and traffic.
Your three options: manual spreadsheets (free but slow), Shopify Plus org analytics (limited), or a dedicated analytics app like Putler (fastest, and works on any Shopify plan).
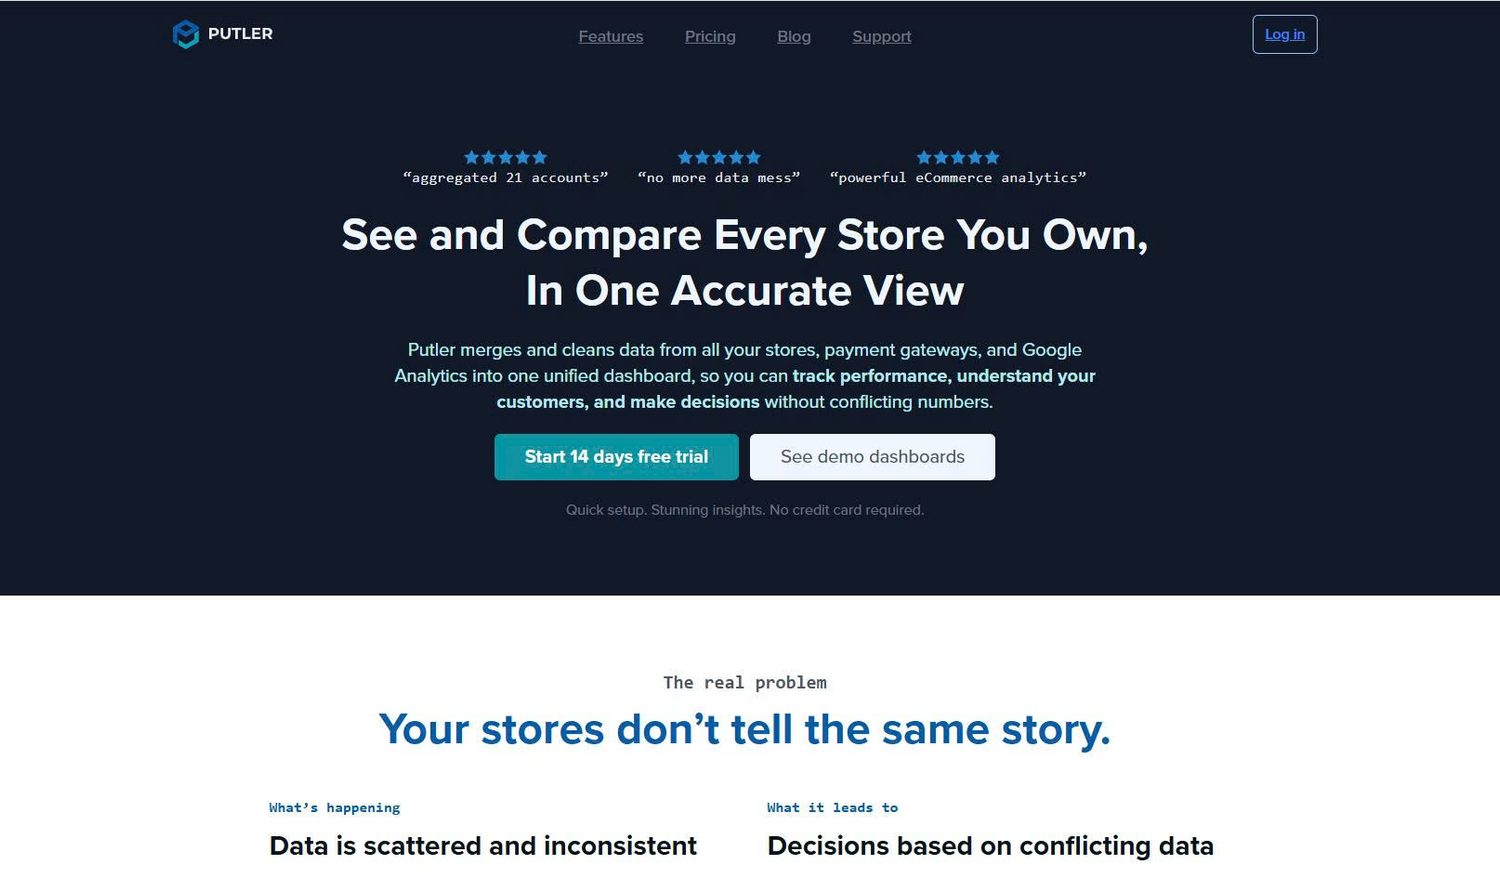
Putler connects all your stores to one account, auto-merges duplicate customers and currencies, and lets you switch between consolidated and per-store views — setup takes about 5 minutes, from $20/month.
1. Why tracking stores separately quietly hurts your business
Separate logins feel like a small annoyance. Over time, they cost you real money and real decisions.
Here’s what “check each store one by one” actually creates:
Wasted hours. Switching between admins and re-pulling the same reports eats time you could spend growing the business.
No combined view. You can’t see total revenue, total orders, or blended Average Order Value (AOV) without exporting and merging spreadsheets.
Double-counted customers. A shopper who buys from two of your stores shows up as two people, so your customer counts and lifetime value are wrong.
Unfair comparisons. Without a shared view, it’s hard to tell which store, product, or promotion is actually pulling its weight.
Slow, gut-based decisions. Manual reporting lags behind reality, so you react late to trends instead of catching them early.
The core problem isn’t any single missing number. It’s that your data is scattered, so you never get one source of truth to act on.
Next step: before choosing a tool, get clear on why Shopify splits this data in the first place — it shapes which fix will actually work.
2. Why Shopify can’t combine your stores on its own
Shopify treats every store as a completely separate business. That’s the root of the problem.
You can’t run multiple Shopify stores under one account. Each store needs its own Shopify account, and its reports only ever cover that one store. You can reuse the same email across stores, but the data stays separate.
This is a structural choice, not a setting you missed. Shopify doesn’t use a multi-store architecture, so separate stores stay separate in native reporting.
What about Shopify Plus? Plus does add organization-level analytics. If your stores sit under one Plus organization, you can see aggregate sales and orders across stores, compare by store or brand, and view results in multiple currencies (Shopify Help Center).
That helps, but it doesn’t fully solve the problem, for three reasons:
It requires Shopify Plus, which sits at enterprise-level pricing that most smaller multi-store merchants aren’t paying.
It’s built around sales and order KPIs. Customer data stays siloed per store, so you still can’t get unified lifetime value or a de-duplicated customer list across brands.
It only sees Shopify. Your payment gateways (PayPal, Stripe) and Google Analytics stay outside the view.
So unless you’re on Plus and only care about top-line sales, you need a reporting layer that sits on top of your stores and pulls everything into one place.
Next step: decide what that layer actually needs to show you.
3. What should a real multi-store dashboard show you?
A good multi-store dashboard does more than stack revenue numbers side by side. It gives you both the big picture and the store-level detail behind it.
Look for these views:
Combined and per-store revenue, orders, and AOV. You want the portfolio total plus the ability to drill into any single store.
De-duplicated customer metrics. New vs returning, lifetime value (LTV), and RFM segments (recency, frequency, monetary value) that treat a repeat cross-store buyer as one person.
Product performance across stores. Your best sellers and slow movers, ranked across the whole business.
Traffic and conversion. Visitors, sources, and how each store turns visits into sales.
Subscriptions and goals. Recurring revenue and churn if you sell subscriptions, plus revenue targets you can track toward.
⚠️ Watch out: If your tool doesn’t merge duplicate customers, convert currencies, and align time zones automatically, your “combined” numbers will be wrong. Accurate consolidation is the whole point — confirm it before you commit.
Next step: compare the three practical ways to build this view.
4. Three ways to track multiple stores in one place
You have three realistic options, and they trade off cost, effort, and accuracy. Here’s how they stack up.
Approach
Setup effort
Combined view
Customer de-dup & multi-currency
Real-time
Cost
Manual spreadsheets
High (ongoing)
Manual merge
Manual, error-prone
No
Free, but time-heavy
Shopify Plus org analytics
Low–Medium
Sales & orders only
Partial (customers stay siloed)
Near real-time
Requires Shopify Plus
Dedicated analytics app (Putler)
Low (~5 min)
Consolidated + per-store
Automatic
Yes
From $20/month
How to decide: If you run 2–3 stores and don’t mind manual work, spreadsheets can limp along. If you’re already on Shopify Plus and only need top-line sales across stores, the built-in organization analytics may be enough. But if you want an accurate, automatic view of sales, customers, products, and visitors across every store — on any Shopify plan — a dedicated analytics app is the fastest path. That’s the option we’ll set up next.
5. How to track multiple Shopify stores in one dashboard with Putler
Putler is an eCommerce analytics tool built to consolidate multiple Shopify stores and data sources into one dashboard. It has done this for over 10 years, serves 7,000+ businesses, and handles 62 currencies — so multi-store, multi-currency reporting is its core job, not an add-on.
The key advantage for you: connect all your Shopify stores to one Putler account, then view the numbers consolidated across the whole business or per store, with duplicate customers and currencies handled automatically.
Here’s how to set it up.
Start a free Putler trial. Go to putler.com and start the 14-day trial. No credit card is required.
Connect your first Shopify store. Choose Shopify as a data source and authorize it through Shopify’s secure login (OAuth). No coding or developer help needed.
Connect your other stores. Add each additional Shopify store the same way. Each store counts as one data source, so check your plan’s data-source limit as you add.
Let your historical data sync. Putler pulls in past orders, products, and customers, then cleans and merges them. You’ll see insights within about 15 minutes of connecting.
Switch between consolidated and per-store views. Use the combined view for your portfolio total, then filter to a single store whenever you need to drill down.
💡 Tip: Setup is no-code and runs through secure OAuth, so a typical connection takes under five minutes per store. You don’t need a developer or a data warehouse.
Once connected, you get a set of dashboards that each answer a different question:
Home — your whole business at a glance: revenue, trends, live sales, and forecasts.
Sales — revenue, refunds, and order trends across stores.
Products — best and worst sellers, plus frequently bought together.
Customers — LTV, RFM segments, and returning vs. new, de-duplicated across stores.
Audience — visitors, traffic sources, and devices.
Transactions — search, filter, and even issue refunds without logging into each store.
Time Machine — forecasts and growth modelling to plan ahead.
Because Putler also connects payment gateways and Google Analytics, you can bring PayPal, Stripe, and GA4 into the same view — useful if some stores share a gateway or you want blended traffic data.
Next step: turn that combined view into decisions, not just a nicer-looking report.
6. How to use your combined dashboard to actually grow
A dashboard only earns its cost when it changes what you do. Here’s how to put a multi-store view to work.
Compare stores and back the winners. Line up revenue, AOV, and conversion side by side, then move budget and attention toward the stores returning the most. Cut or rework the ones that consistently lag.
Cross-promote your best products. When you can see top sellers across the whole business, you can feature a proven product from one store as an upsell or gift with purchase on another.
Design promotions per store, using real numbers. Use each store’s AOV and customer segments to set the right offer — for example, a product bundle or free-gift threshold set just above that store’s current AOV to nudge order value up without hurting margin.
Set targets and track them. Set a monthly revenue goal for the portfolio, then watch progress in one place so you can adjust promotions mid-month instead of after.
Plan with forecasts. Use forecasting to anticipate slow and peak periods, then schedule inventory buys and campaigns before the rush.
Next step: avoid the traps that make multi-store tracking unreliable.
7. Common mistakes to avoid
Most multi-store reporting problems come from a few repeatable errors. Watch for these.
Living in manual exports. Spreadsheets don’t scale and break the moment someone forgets to update them.
Skipping customer de-duplication. Counting cross-store buyers twice inflates your customer numbers and distorts LTV.
Ignoring currency and timezone alignment. Un-normalized data quietly corrupts your totals and trends.
Chasing vanity metrics. Total visits feel good, but AOV, LTV, and conversion drive real decisions.
Collecting data you never act on. A dashboard you don’t check is just a prettier version of the old problem.
✅ Monthly checklist: Confirm each store is connected and syncing. Spot-check that your combined revenue matches the sum of each store’s native total. Review AOV and top products per store. Adjust one promotion based on what you see.
Next step: put it together and get your first combined view live.
Conclusion
Running multiple Shopify stores shouldn’t mean running blind. Separate logins hide your real performance and slow every decision you make.
One dashboard fixes that. When your stores feed a single, de-duplicated, multi-currency view, scattered data becomes a clear picture you can act on.
Start simple: connect your stores to a tool like Putler, open the combined revenue and AOV view, and use it to decide where to focus next. That one habit — checking the whole business in one place — is what turns multiple stores from a headache into an advantage.
FAQs
Can I run multiple Shopify stores under one account?
No. Each Shopify store needs its own account, though you can use the same email across them. On Shopify Plus, separate stores can be grouped under one organization for central admin, but they’re still individual stores.
Does Shopify show combined reports for multiple stores?
Not on standard plans — native reports cover one store at a time. Shopify Plus adds organization analytics that aggregate sales and orders across stores, but customer data stays siloed per store and non-Shopify sources aren’t included. A dedicated tool like Putler gives a combined view on any plan.
Can one dashboard track more than just Shopify?
Yes. Putler connects 17+ sources, including PayPal, Stripe, WooCommerce, and Google Analytics, so you can blend Shopify data with your payment gateways and website analytics in one view.
How many stores can I connect at once?
It depends on your plan’s data-source allowance — each store counts as one source. Putler’s Starter plan includes 3 data sources and Growth includes 15, so pick the tier that matches how many stores (and gateways) you want to connect.





![[2026] Shopify Testimonials: 3 Ways To Add Them + Best Apps](https://bogos.io/wp-content/uploads/2026/10/Shopify-Testimonials-400x225.jpg)