![[2026] Shopify Instant Checkout: ChatGPT, Shop Pay & Buy Now Button](https://bogos.io/wp-content/uploads/2026/07/Shopify-instant-checkout-400x225.jpg)
Charlie Ngo
•
Last updated: 8 July, 2026
[2026] Shopify Instant Checkout: ChatGPT, Shop Pay & Buy Now Button
Shopify instant checkout means three different things, and the most important one changed in 2026. It can mean buying...
Shopify Conversion Rate Optimization: 4 Main Pillars (2026)
Marketing Manager
Summarize this post with AI
Your Shopify traffic looks healthy. Your sales do not match it. That gap is a conversion problem, and Shopify conversion rate optimization is how you close it. This guide shows you how to find where your store loses sales, fix the biggest leaks in order, and measure whether the changes actually worked. I’m Charlie, Marketing Manager at BOGOS, where we help Shopify merchants turn more visitors into buyers with smarter offers. Everything below is built on real store data and sources you can check yourself.
Shopify conversion rate optimization, or CRO, is the work of turning a larger share of your store’s visitors into customers. A conversion is usually a purchase. It can also be an add to cart, an account signup, or a newsletter subscription.
CRO matters because it grows sales from the traffic you already have. You pay for that traffic once, so converting more of it costs far less than buying more. It is also the one lever that compounds: fix the funnel once, and every visitor after that converts at a higher rate. That makes CRO central to any plan to increase average order value and boost Shopify sales overall.
The formula is simple.
Conversion rate = (orders ÷ visitors) × 100
Say your store gets 10,000 visitors in a month and 140 of them buy. Your conversion rate is 1.4%.
Shopify measures this by sessions out of the box. That means orders divided by total online store sessions. You can also measure by unique visitors if you want to know how many individual people convert, regardless of how often they return. Pick one method and stick with it, so your numbers stay comparable over time.
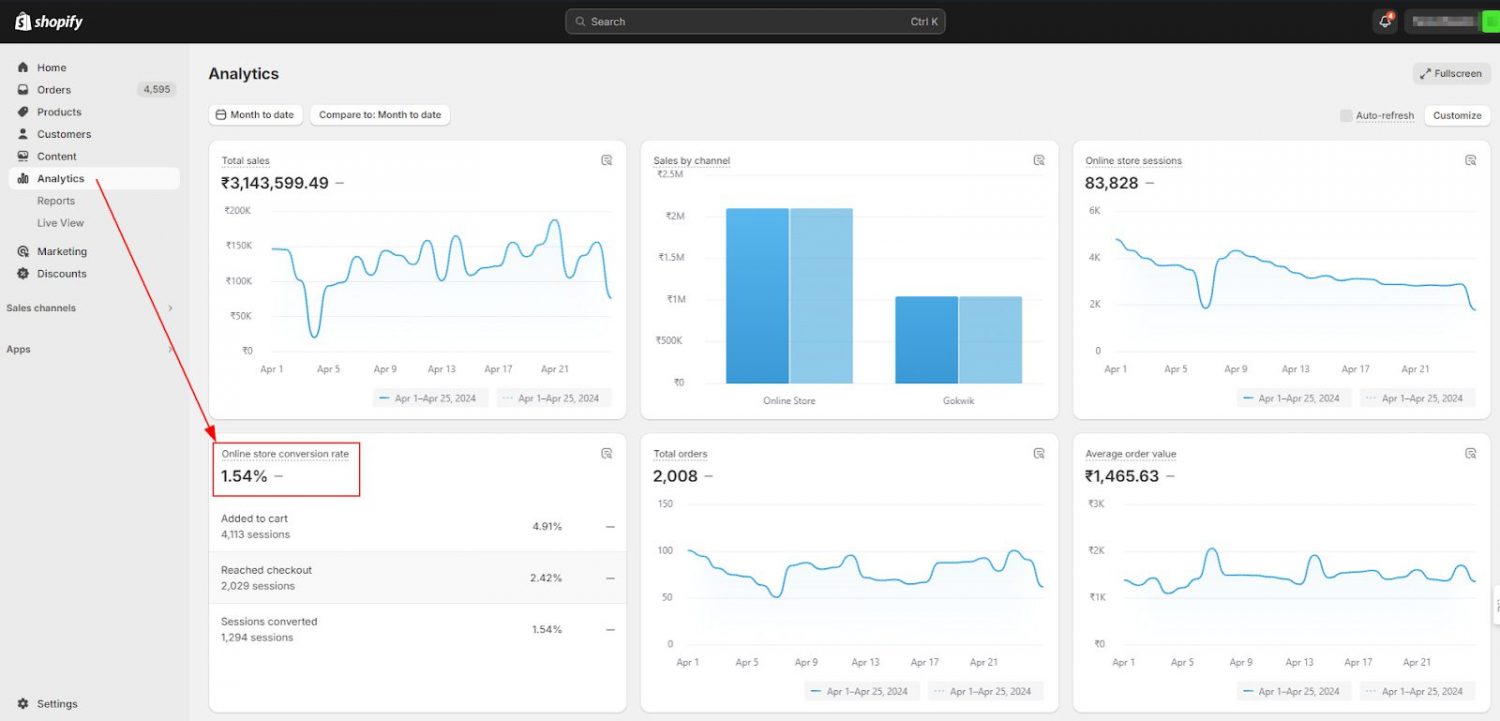
You rarely need to do the math by hand. In your Shopify admin, open Analytics. The dashboard shows your online store conversion rate, and the conversion funnel below it splits that rate into three steps: sessions that added to cart, sessions that reached checkout, and sessions that completed a purchase. That breakdown alone often points to where you are losing sales.
Treat every benchmark as a range, not a target. Your “good” number depends on what you sell and where your shoppers come from.
The average Shopify store converts around 1.4%. Cross more than 3.2% and you are in the top 20% of Shopify stores. Cross 4.7% and you are in the top 10%. Across broader ecommerce, averages run higher, closer to 2% to 3% depending on region.
Conversion rates swing widely by vertical. Here is how Shopify’s own benchmark data breaks down.
| Industry | Average conversion rate |
|---|---|
| Food and beverage | 6.22% |
| Beauty and personal care | 4.94% |
| Multi-brand retail | 3.93% |
| Fashion, accessories, and apparel | 3.06% |
| Home and furniture | 1.41% |
| Luxury and jewelry | 0.94% |
Desktop and tablet still convert a little higher than mobile, though the gap is closing fast as one-tap wallets like Shop Pay and Apple Pay smooth out mobile checkout. These are broad ecommerce averages; Shopify stores run lower overall, but the pattern holds.
| Device | Average conversion rate |
|---|---|
| Tablet | ~3.1% |
| Desktop | ~3.1% |
| Mobile | ~2.9% |
Source: Dynamic Yield benchmark data.
Mobile is still your biggest opportunity. It carries most of your traffic, so a small mobile gain moves more revenue than a large desktop one. If your mobile rate sits far below desktop, the fix is almost always checkout: fewer form fields and one-tap payment.
Where a visitor comes from shapes how likely they are to buy, because intent travels with the visitor. Someone who searches “buy running shoes size 10” is ready to buy. Someone who taps a shoe ad while scrolling Instagram is not.
| Traffic source | Typical conversion rate |
|---|---|
| 2–8% | |
| Referral / affiliate | 4–5.4% |
| Direct | 3–3.5% |
| Organic search | 2–4% |
| Paid search | ~1.8% |
| Social media (Facebook, Instagram, TikTok) | 0.7–1.5% |
Typical ranges that vary by store and offer. Source: 2026 ecommerce benchmark data.
Email and referral visitors convert highest, because they arrive pre-qualified. Social visitors convert lowest, because they are browsing, not buying. So judge each channel against itself, not against a single blended rate.
Geography matters too, mostly because of payment habits, shipping expectations, and how mature online shopping is in each market. Dynamic Yield data shows a clear pattern.
| Region | Average conversion rate |
|---|---|
| Americas | ~2.9% |
| EMEA (Europe, Middle East, Africa) | ~2.7% |
| APAC (Asia-Pacific) | ~1.8% |
If you sell across regions, localize your payment methods. A German shopper who cannot pay by their usual method, or an Australian who does not see a familiar buy-now-pay-later option, is less likely to convert.
Put these benchmarks together before you judge your store. A 2% rate is weak for a food brand but strong for a furniture store, and it looks different again once you factor in your device mix, your traffic sources, and the regions you sell to. So compare yourself to stores like yours, on the same channels and markets, not to a single global average. The better question is not whether your rate is good, but whether it is improving.
Most CRO guides hand you a long list of tips. The problem is that you do not need all of them. You need the two or three that fix your store. So before you change anything, find the leak.
Think of your store as a funnel with four stages. Walk each one and look for the steepest drop-off.
Start at the top. Are the right people arriving? A flood of low-intent visitors will tank your rate even when the store works fine.
Channels convert at very different rates, as the benchmark table above shows, so judge each one against itself, not a single blended rate. A 1% rate from social can be healthy. The same rate from organic search means your landing pages are not matching the intent that brought shoppers in.
Content type matters too. A page built around your products will rarely go viral, but it pulls in shoppers close to buying. A viral post brings a crowd of browsers who leave. Aim your content at buyers, not just clicks.
Next, check your add-to-cart rate. If visitors land on product pages and leave without adding anything, the problem is the page: weak images, thin copy, missing answers, or unclear pricing.
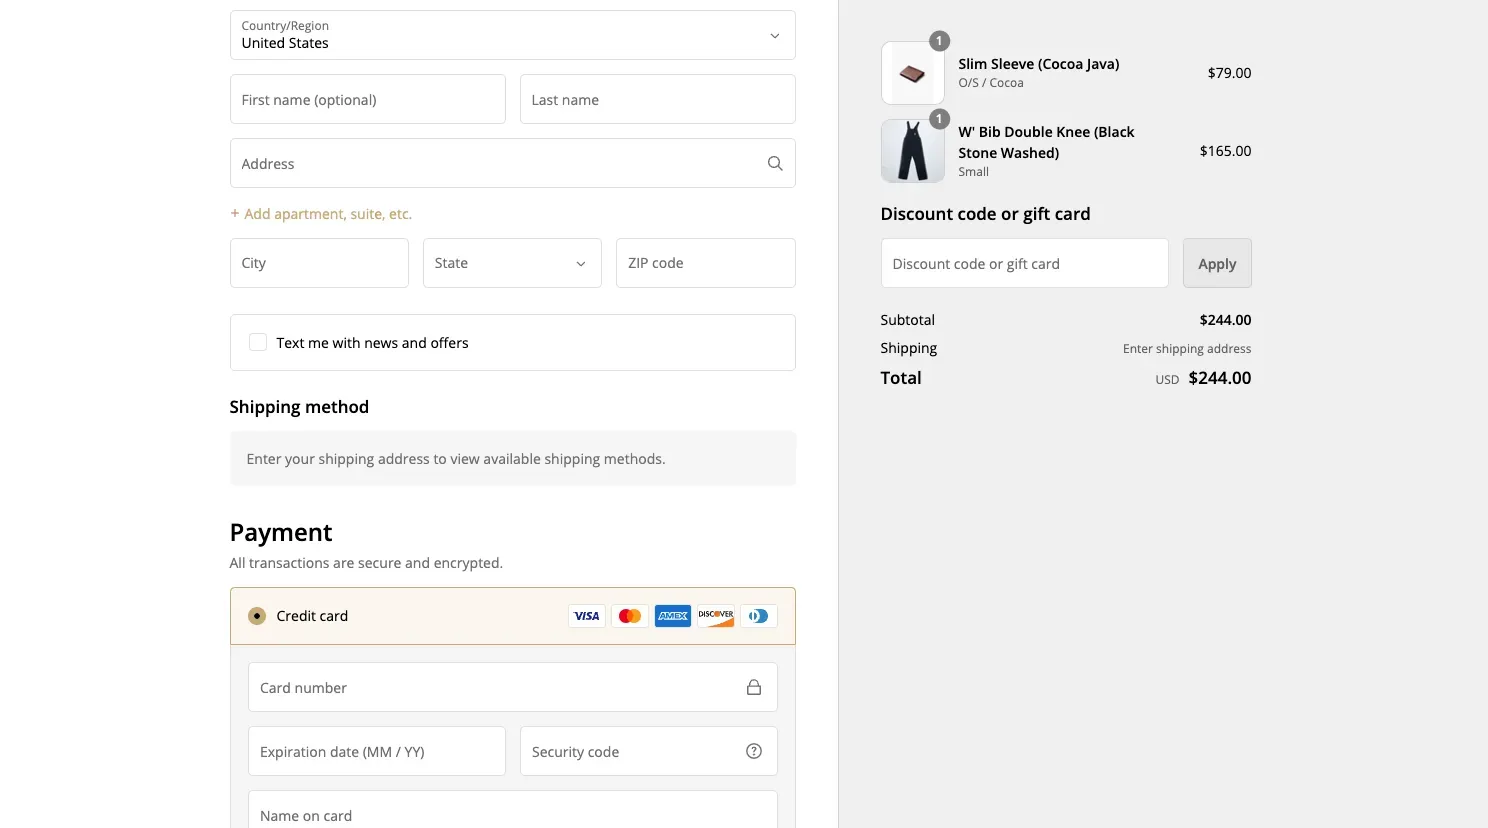
Then look at the cart. This is where cost surprise bites. Shoppers add an item, see shipping and tax appear, and leave. The data is blunt here. Around 70% of carts are abandoned, and the leading reason is unexpected extra costs, cited by roughly 48% of shoppers.
Finally, the checkout itself. Forced account creation drives off about 26% of shoppers. A long or complicated checkout drives off another 18%. Count the steps and the fields. Every extra one costs you orders.
The takeaway is simple. Fix the stage that leaks most, not the one that is easiest to change. In this article, we have gathered 9 best ways you can optimize your checkout page for more conversions: Shopify Checkout Optimization: 9 Ways to Boost Your CR (2026)
Once you know where the leak is, here is what to do about it. The strategies run from “understand first” to “fix” to “test.” Start with the ones that match your weakest funnel stage.
You cannot fix a leak you have not found, so pull your own numbers before you change anything.
Watch five metrics. A sharp drop at one of them points straight at the stage to fix.
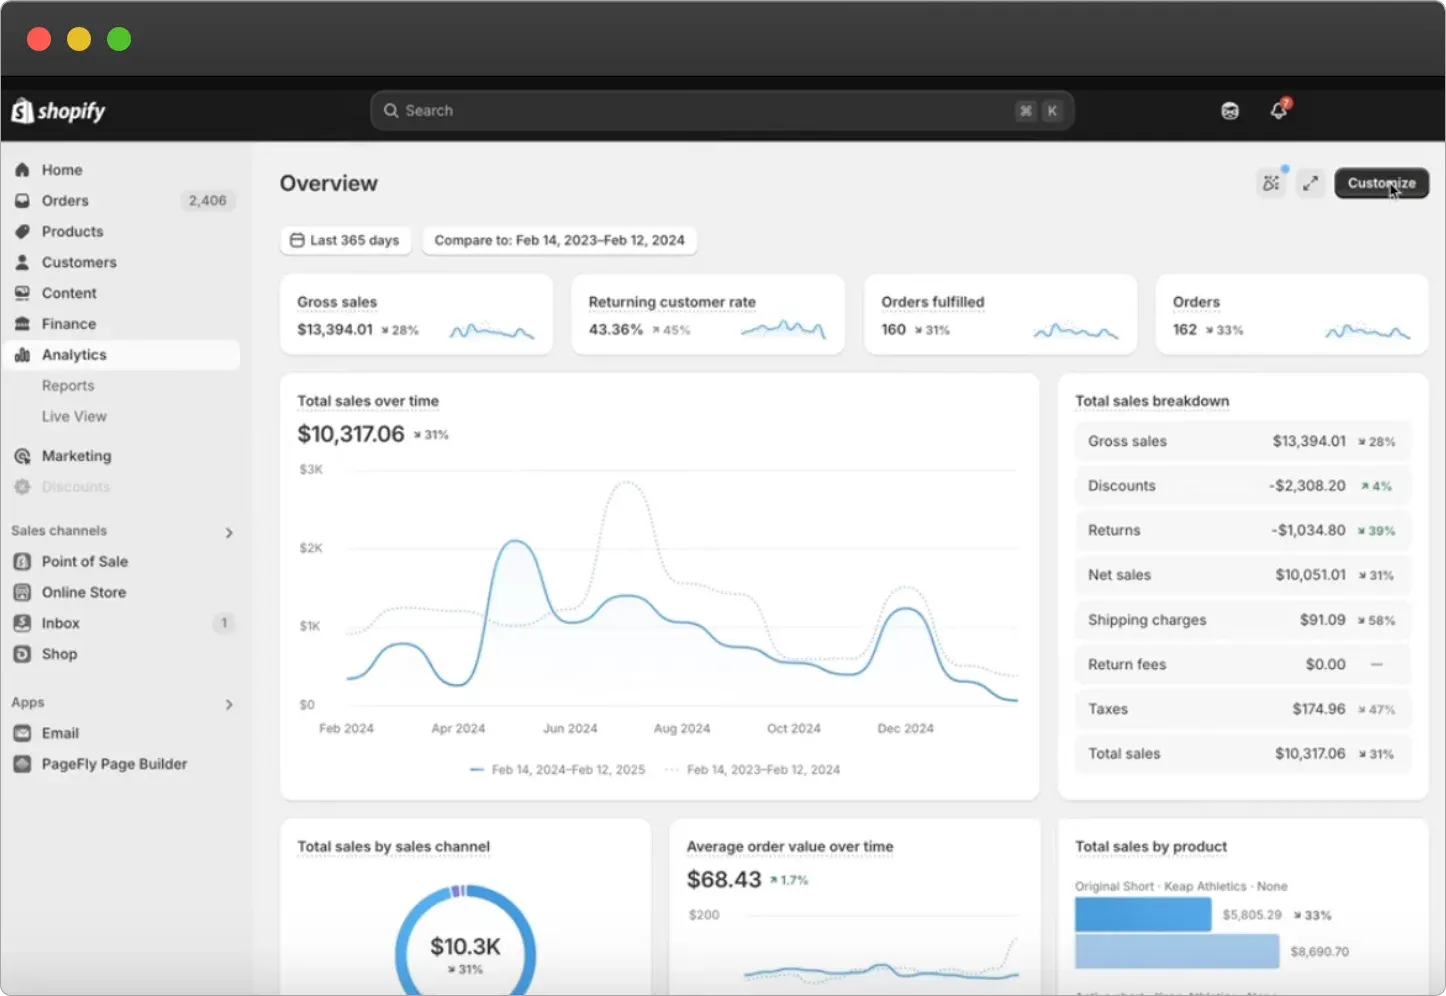
Use the right tool for each job. Shopify Analytics shows your conversion funnel by session. Google Analytics adds channel and landing-page detail.
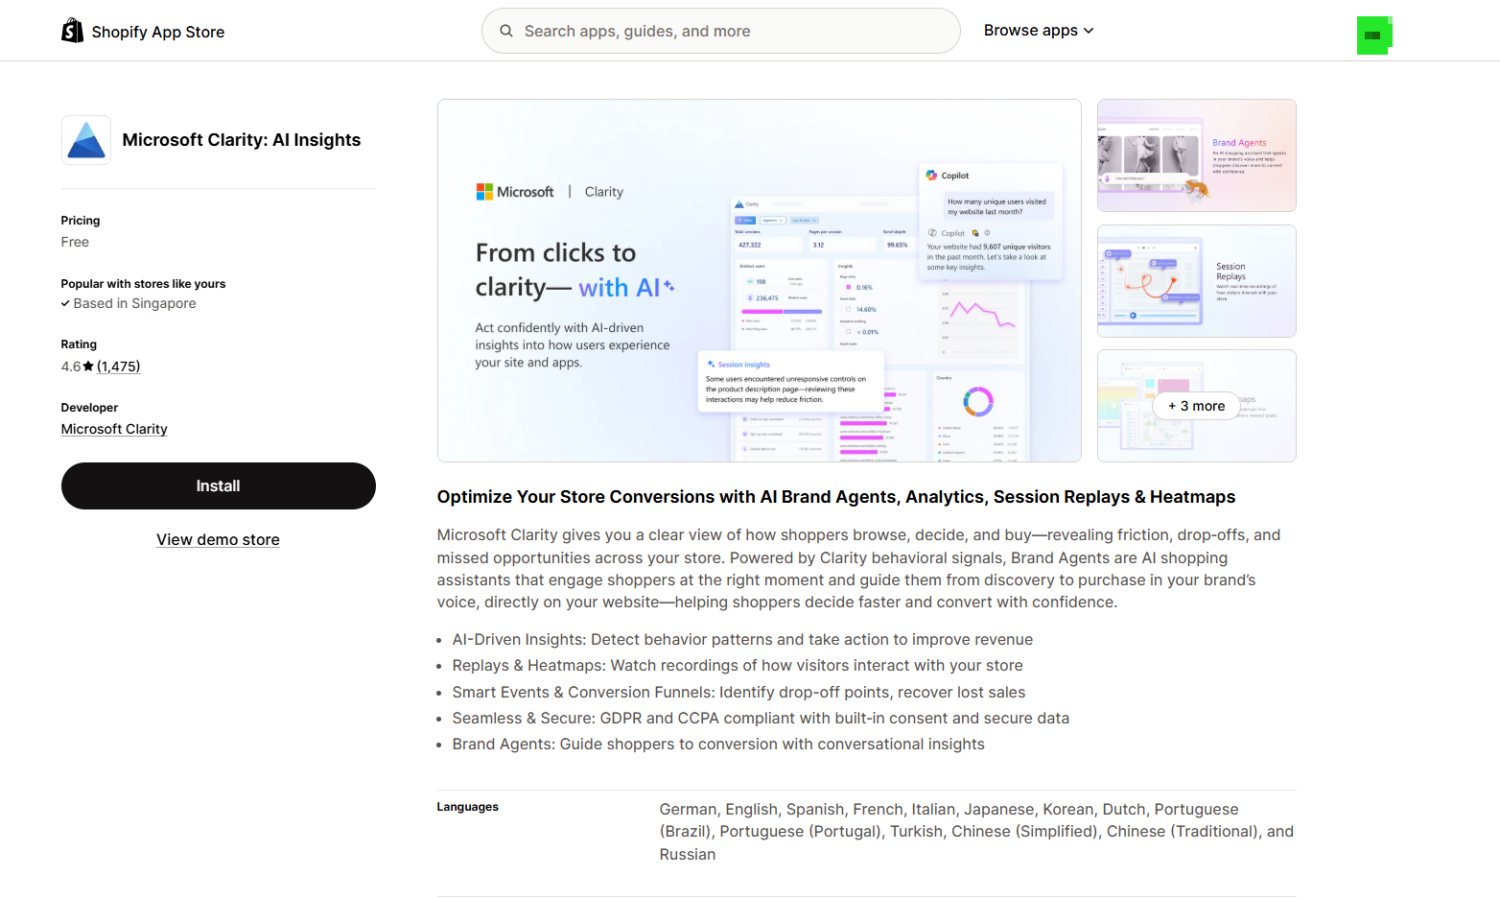
Then add the why with behavior tools: heatmaps and session recordings show where shoppers hesitate. Microsoft Clarity is free and integrates with Shopify, while Hotjar and Lucky Orange add deeper recordings and on-site surveys. A one-question survey, such as “What almost stopped you from buying today?“, often reveals more than any chart. Numbers tell you where you lose people. Behavior tells you why.
Your shoppers compare you to other stores in your niche before they buy, so your competitors set the expectations you have to meet. Studying them shows you the bar.
Focus on the things that change a buying decision:
Note what every top store does, because that is now the default shoppers expect. You are not copying. You are finding the gaps where you fall short, then testing whether closing them lifts your numbers.
Speed sells, and the reason is simple: every extra second of waiting gives a shopper a reason to leave. Pages that load in one second convert at 3.05%, while five-second pages convert at just 1.08%. That is nearly a 3x gap from speed alone. Even a 0.1-second improvement in mobile speed lifts retail conversions by 8.4%.
Google measures this experience with three Core Web Vitals. They track how fast your page loads, how quickly it responds to a tap, and how stable it stays while loading. Poor scores hurt both your conversions and your search ranking, so they are worth watching. Check yours for free in Google PageSpeed Insights.
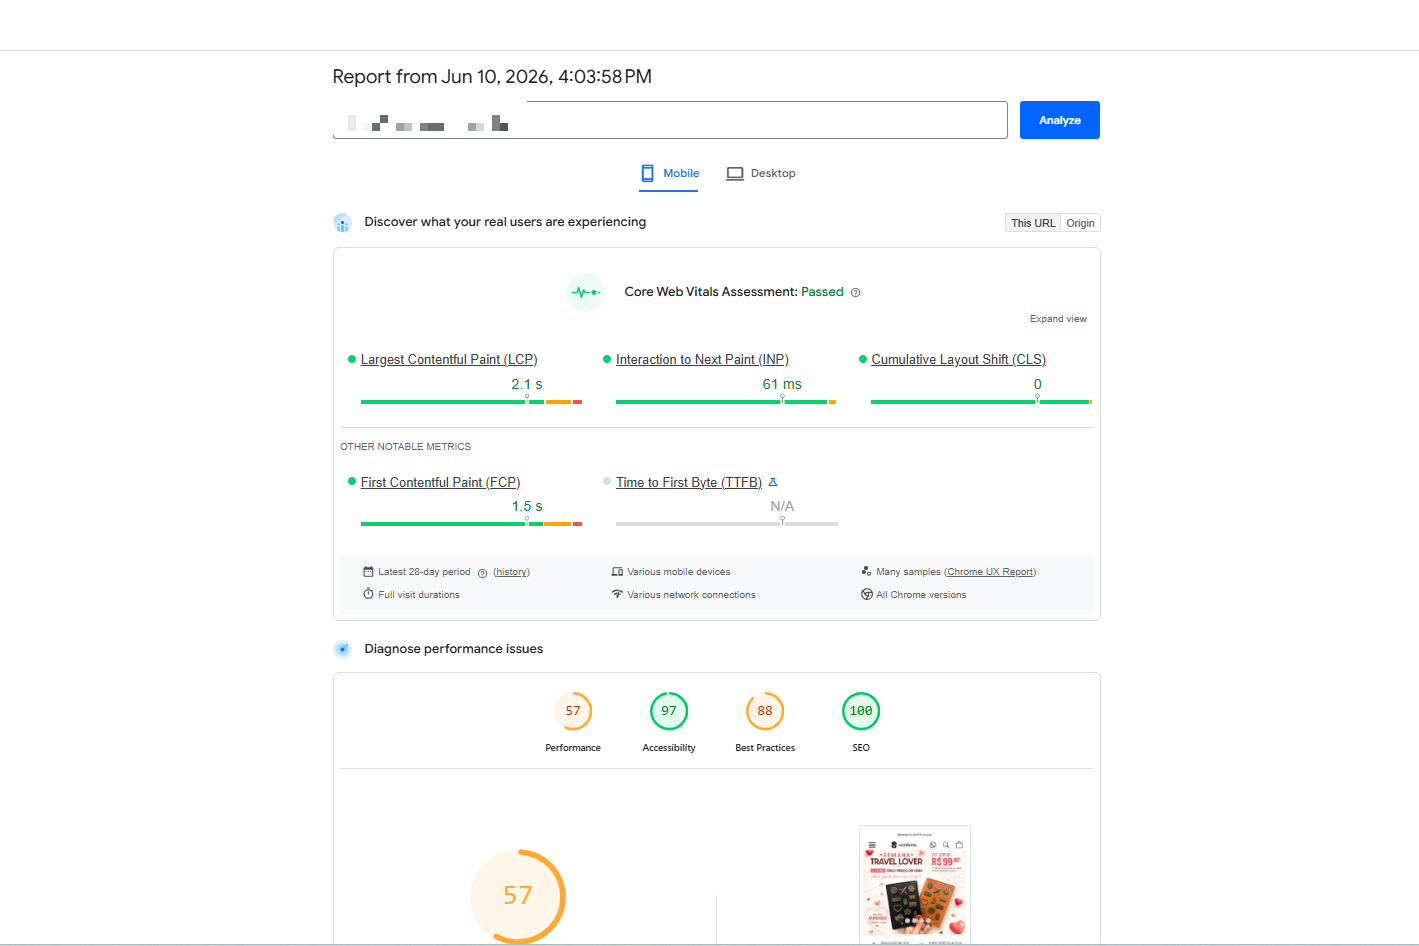
| Metric | What it measures | Good | Needs work | Poor |
|---|---|---|---|---|
| LCP (Largest Contentful Paint) | Time for the largest element (image, text, video) to finish loading | ≤ 2.5s | 2.5s–4s | > 4s |
| INP (Interaction to Next Paint, replaced FID) | Delay before the page responds to a tap, type, or scroll | ≤ 200ms | 200–500ms | > 500ms |
| CLS (Cumulative Layout Shift) | How much the layout jumps around as the page loads | ≤ 0.1 | 0.1–0.25 | > 0.25 |
Here is how to move those numbers in the right direction:
Then watch the speed report under Analytics, and track it weekly next to sales.
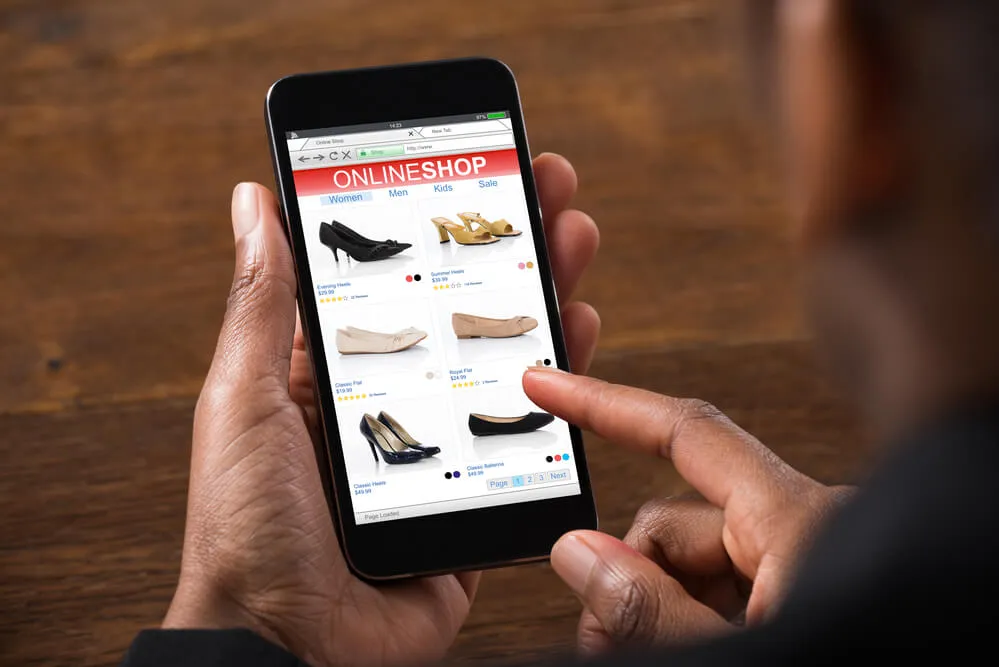
Most store traffic now comes from phones – around 65% to 75% of ecommerce visits – yet mobile converts lower than desktop. The reasons are practical: small screens make products and buttons harder to tap, typing card and address details is fiddly, phone shoppers are often distracted or on slower connections, and many browse on mobile but switch to a laptop to buy. Close that gap and you win back real revenue.
The product page is where the buying decision happens. It does the selling a salesperson would do in a shop, but with no one there to answer questions. Leave a doubt unanswered, and the shopper leaves.
Most product pages fail in the same few ways: too few photos, copy that lists specs instead of benefits, no answer to obvious questions like sizing or shipping, and a buy button that is hard to find on a phone. Each gap plants a doubt, and doubt kills the sale.
Fix them with a few moves:
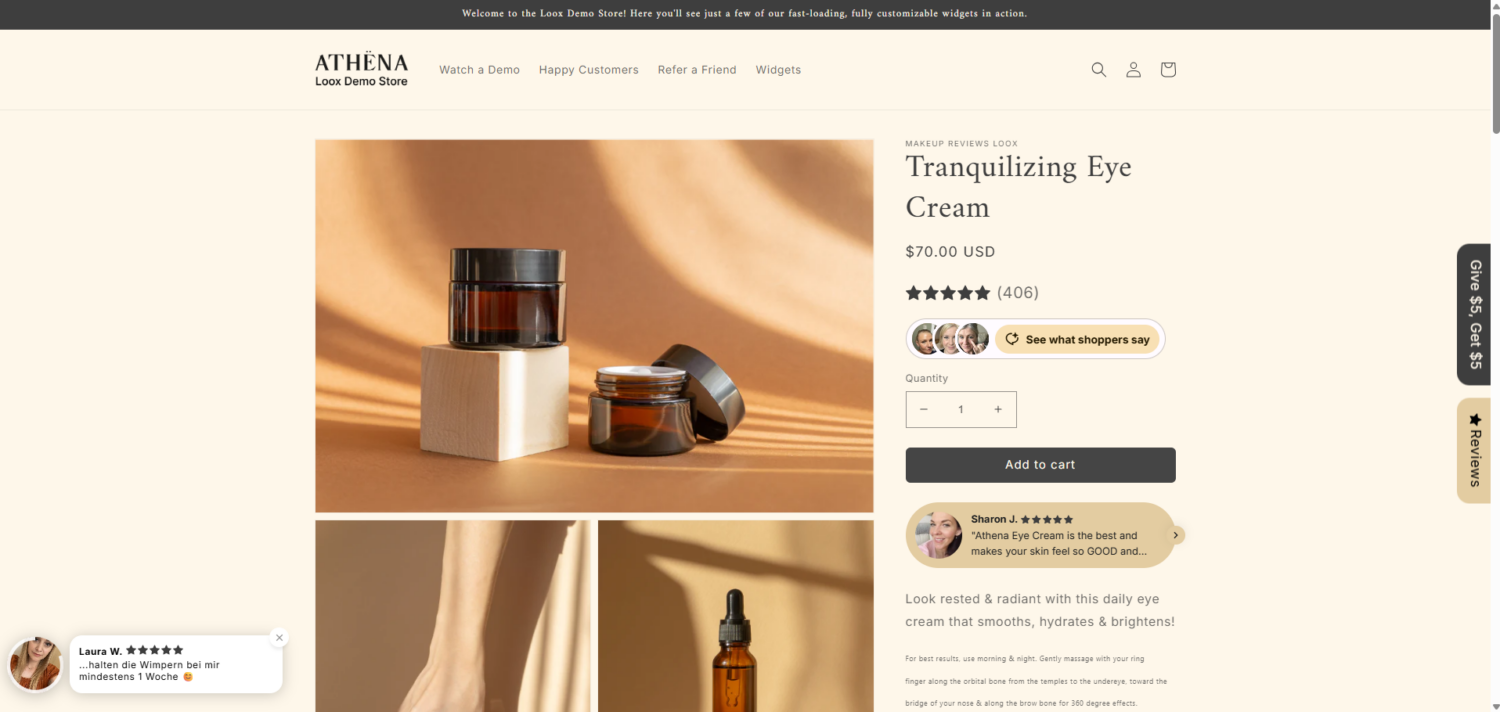
Shoppers buy from stores they trust. Around 98% of consumers read reviews before they buy. Make that trust easy to find.
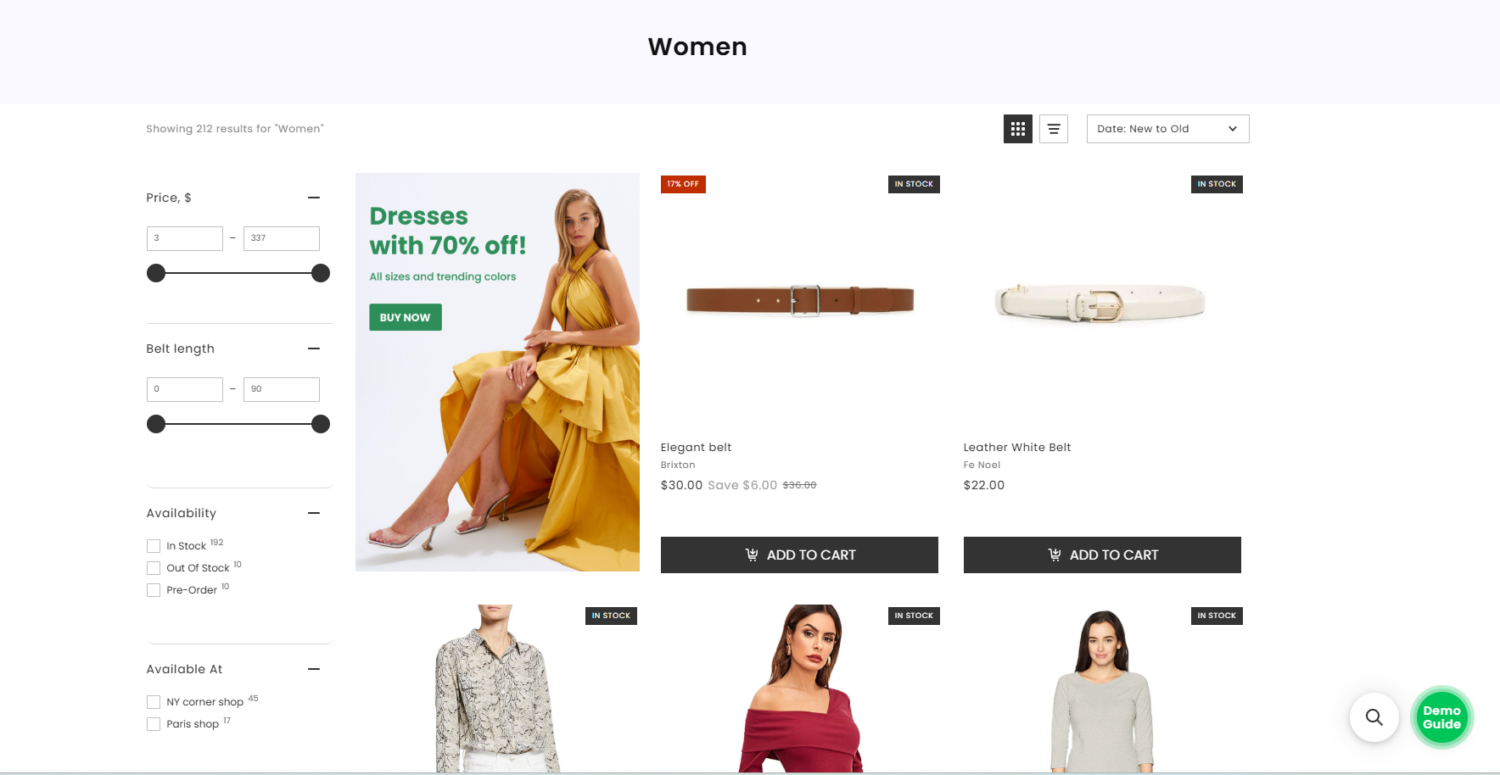
A shopper who cannot find a product cannot buy it, no matter how good the product is. This matters more than it looks, because roughly 69% of shoppers head straight for the search bar, and those searchers are some of your highest-intent visitors. They already know what they want.
So make finding easy:
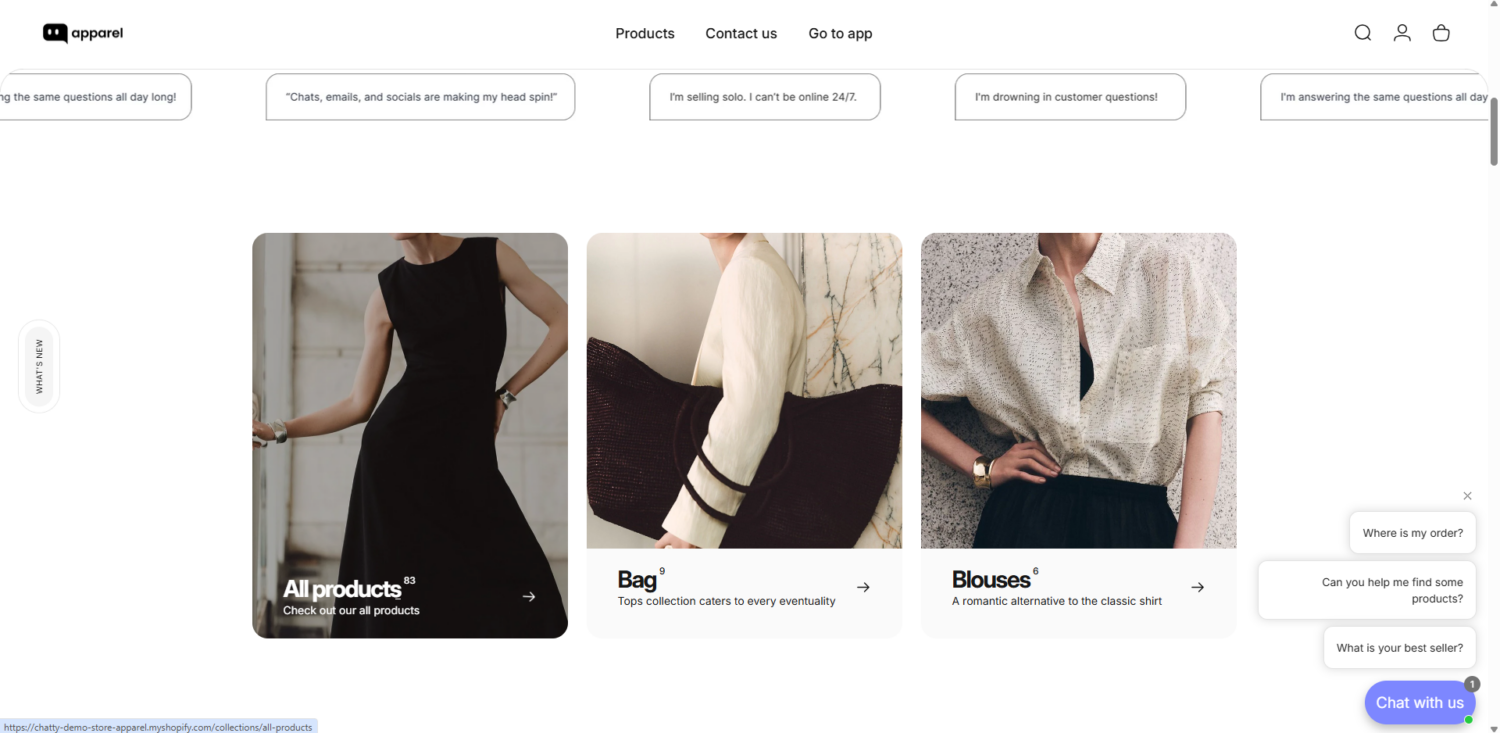
A single unanswered question can lose a sale. Live chat removes that doubt in the moment. Adding live chat can lift conversions by up to 40%. It works hardest right before checkout, when hesitation peaks.
This is where most stores leak the most, so it often pays back fastest.
👉 Read more: Shopify Checkout Optimization: 9 Ways to Boost Your CR (2026)
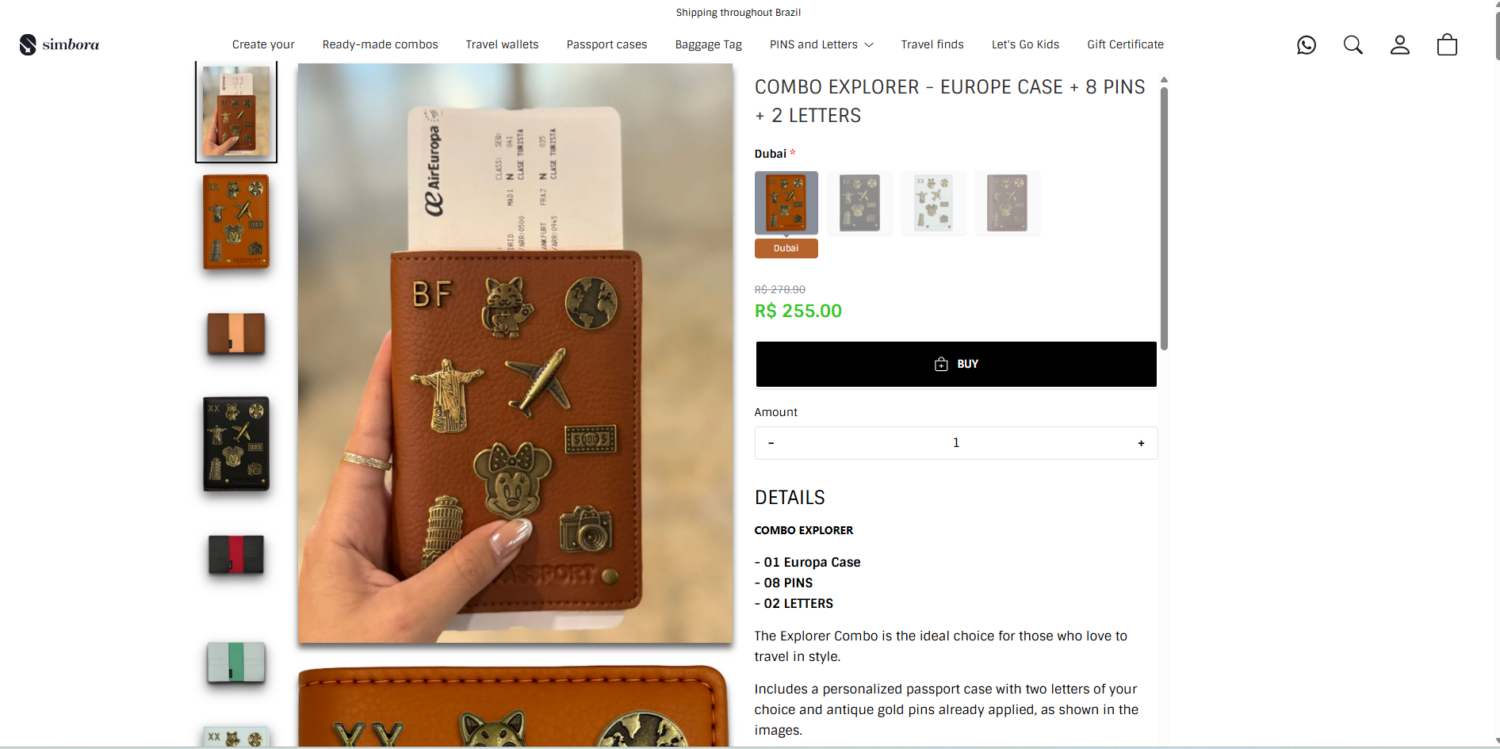
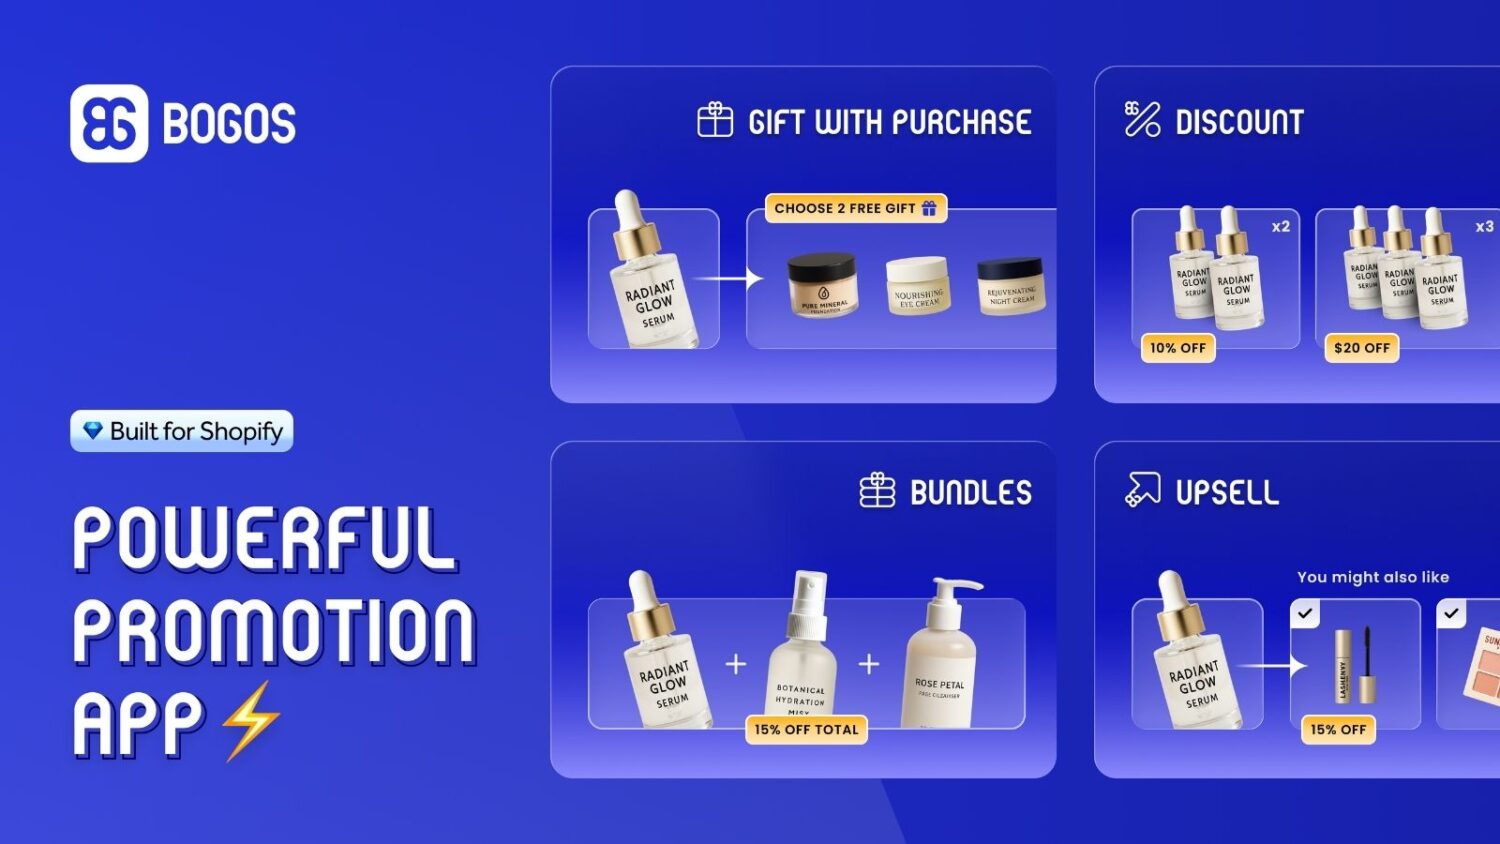
Most CRO guides treat offers as a pure average-order-value play. Some are. But two kinds of offer also lift conversion, because they answer the cost objection at the exact moment a shopper hesitates.
The number one reason people abandon a cart is unexpected cost. An offer that proves value before checkout meets that objection head-on.
Other offers mainly grow the order rather than the conversion rate, and that is fine as long as you know the difference. Product bundles simplify the decision and lift the basket. Upsells and cross-sells put the right add-on in front of the shopper at the right time. Their main job is AOV, though a well-judged bundle can still nudge a wavering shopper by making the deal feel better.
A quick real example: a stationery store, Missing Pen, used targeted bundles and a gift with purchase instead of a sitewide discount, and earned €36,000 in extra revenue with a 19% lift in AOV, with no markdown on its premium range.
One honest note: treat any “X% lift” claim as a ceiling, not a promise. Your result depends on your products, margins, and audience.
You can run all of these offers on Shopify with a promotions app. Our own app, BOGOS, keeps free gifts, bundles, and shipping thresholds working together instead of conflicting at checkout.
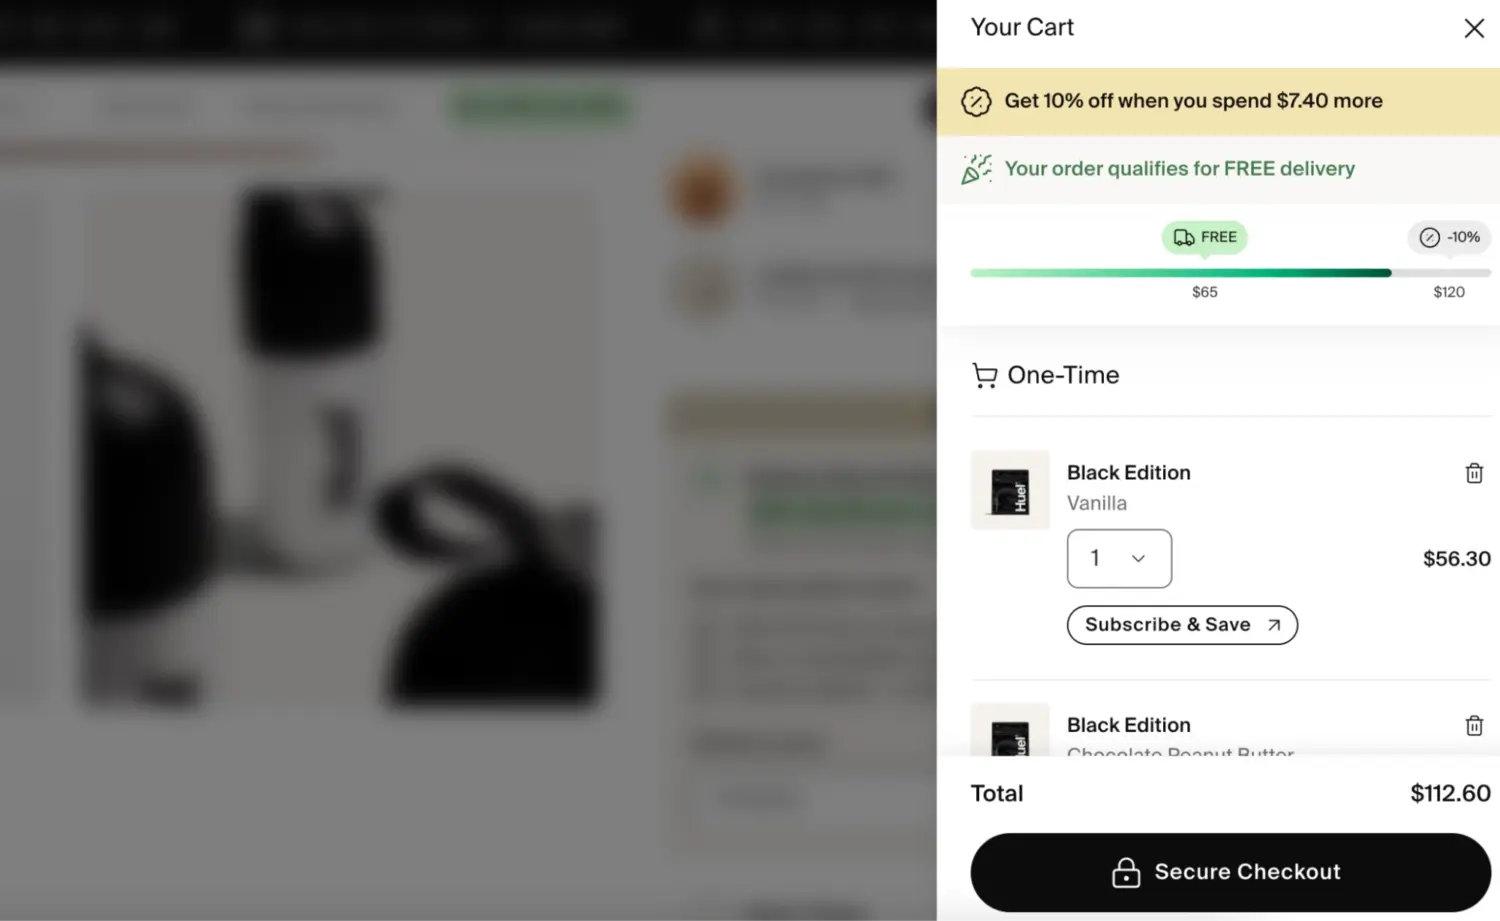
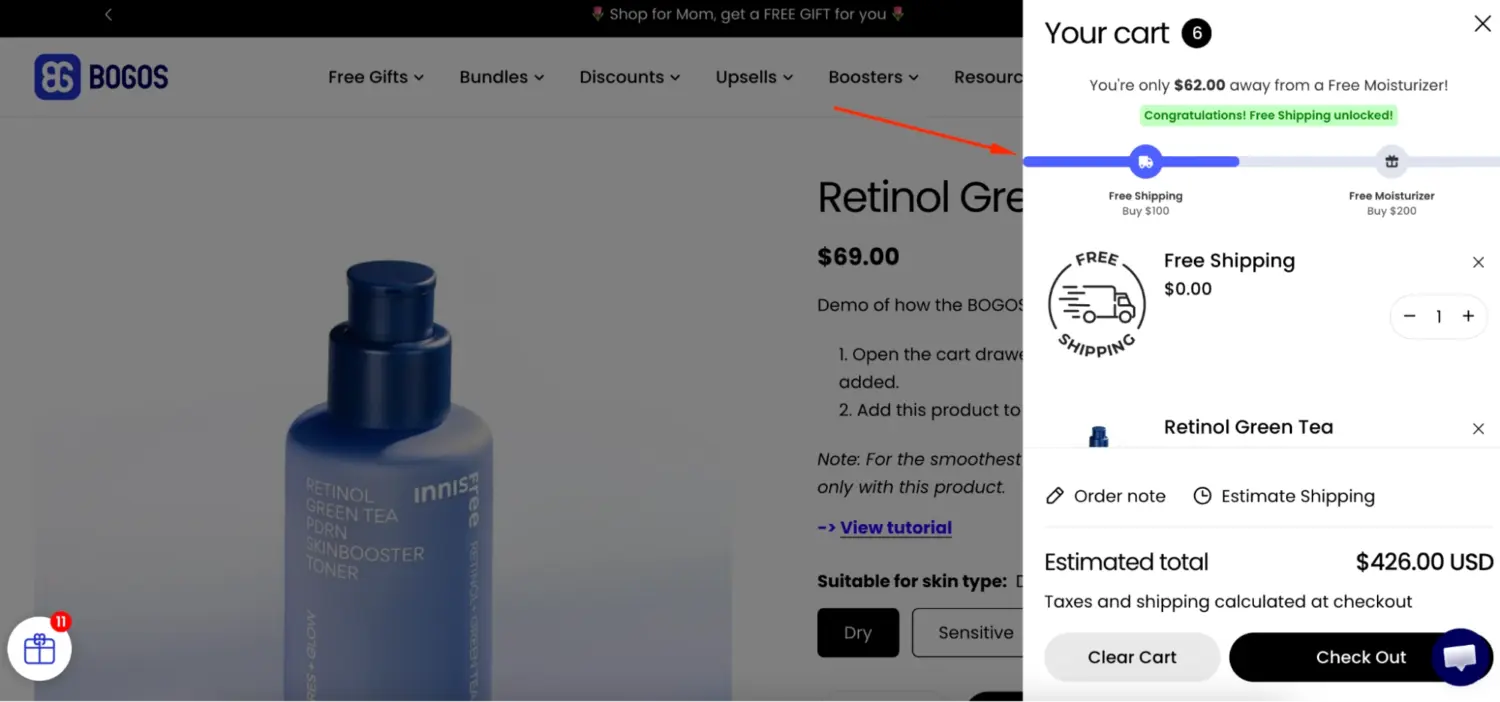
An offer only works if shoppers notice it. Three on-site widgets make that happen, and you can add all of them to a Shopify store through a promotions app.

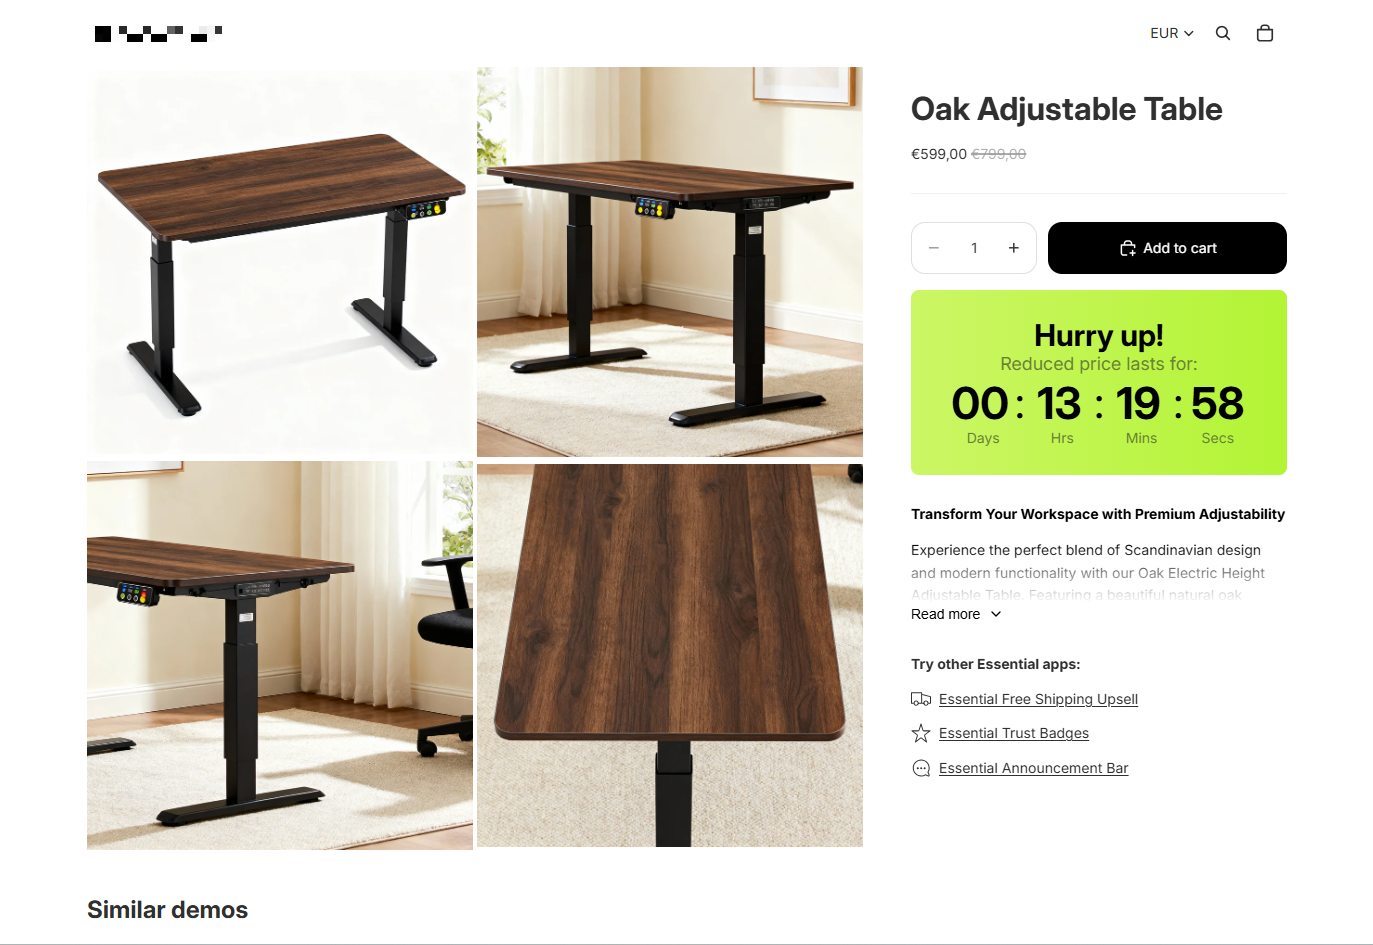
Big moments bring a flood of high-intent traffic. Black Friday and Cyber Monday, Christmas, Valentine’s Day, Mother’s and Father’s Day, and product launches all pull shoppers who are ready to buy.
The scale is hard to ignore. Over the 2025 Black Friday-Cyber Monday weekend, Shopify merchants sold a record $14.6 billion, peaking at $5.1 million per minute. For a Shopify merchant, BFCM is the single most important sales season of the year. Miss the preparation, and you miss your biggest selling window.
Competition spikes in those windows too. A smooth, well-prepared offer converts far more of that traffic than a last-minute scramble.
Running several offers at once without conflicts is the hard part of a big sale. Set up and test your promotions app well before the rush, not during it.
A shopper who added to cart already showed strong intent. Something small stopped them: a distraction, a shipping question, a moment of doubt. That makes these shoppers far easier to convert than a cold visitor, so recovery is some of the cheapest revenue you can win back.
The scale is large. Baymard estimates that stores in the US and EU sit on around $260 billion in recoverable sales each year, lost to cart abandonment. And the tool to claim it is simple: abandoned cart emails recover an average of about 10% of otherwise-lost sales, typically 8% to 15%, which makes them one of the highest-ROI flows in ecommerce.
Set up a short follow-up sequence by email and SMS. Time the first message within an hour, while intent is still warm. Address the likely reason they paused, such as a reminder of your free returns or a nudge about the item selling out, rather than a generic “you left something behind.” Keep discounts as a last step, so you do not train shoppers to abandon on purpose.
Most CRO advice is generic, but your store and your shoppers are not. A change that lifts one store can sink another. Testing is how you learn what works for you, instead of betting on a hunch.
Run an A/B test: show half your visitors the current version and half the new one, then compare. Change one thing at a time, so you know what caused the result. Give the test enough traffic and time, usually 2 to 4 weeks, to tell a real lift from random noise. A clean test settles the question with data and saves you from rolling out a change that quietly costs you sales.
Nail the foundations above first. These shifts are where conversion optimization is heading in 2026, and each one already has results behind it, not just hype.
AI now tailors what each shopper sees and answers their questions in real time: personalized recommendations, dynamic content, and chat assistants that handle objections the way a sales associate would. It is trending because it pays. McKinsey links strong personalization to a 10% to 15% revenue lift, and early adopters report real conversion gains, with Michael Kors citing a 15% to 20% improvement from its AI rollout.
Shopify builds this into its own tools, like the Sidekick assistant. The practical step is to feed any AI accurate product, shipping, and returns data, so it recommends and answers correctly.
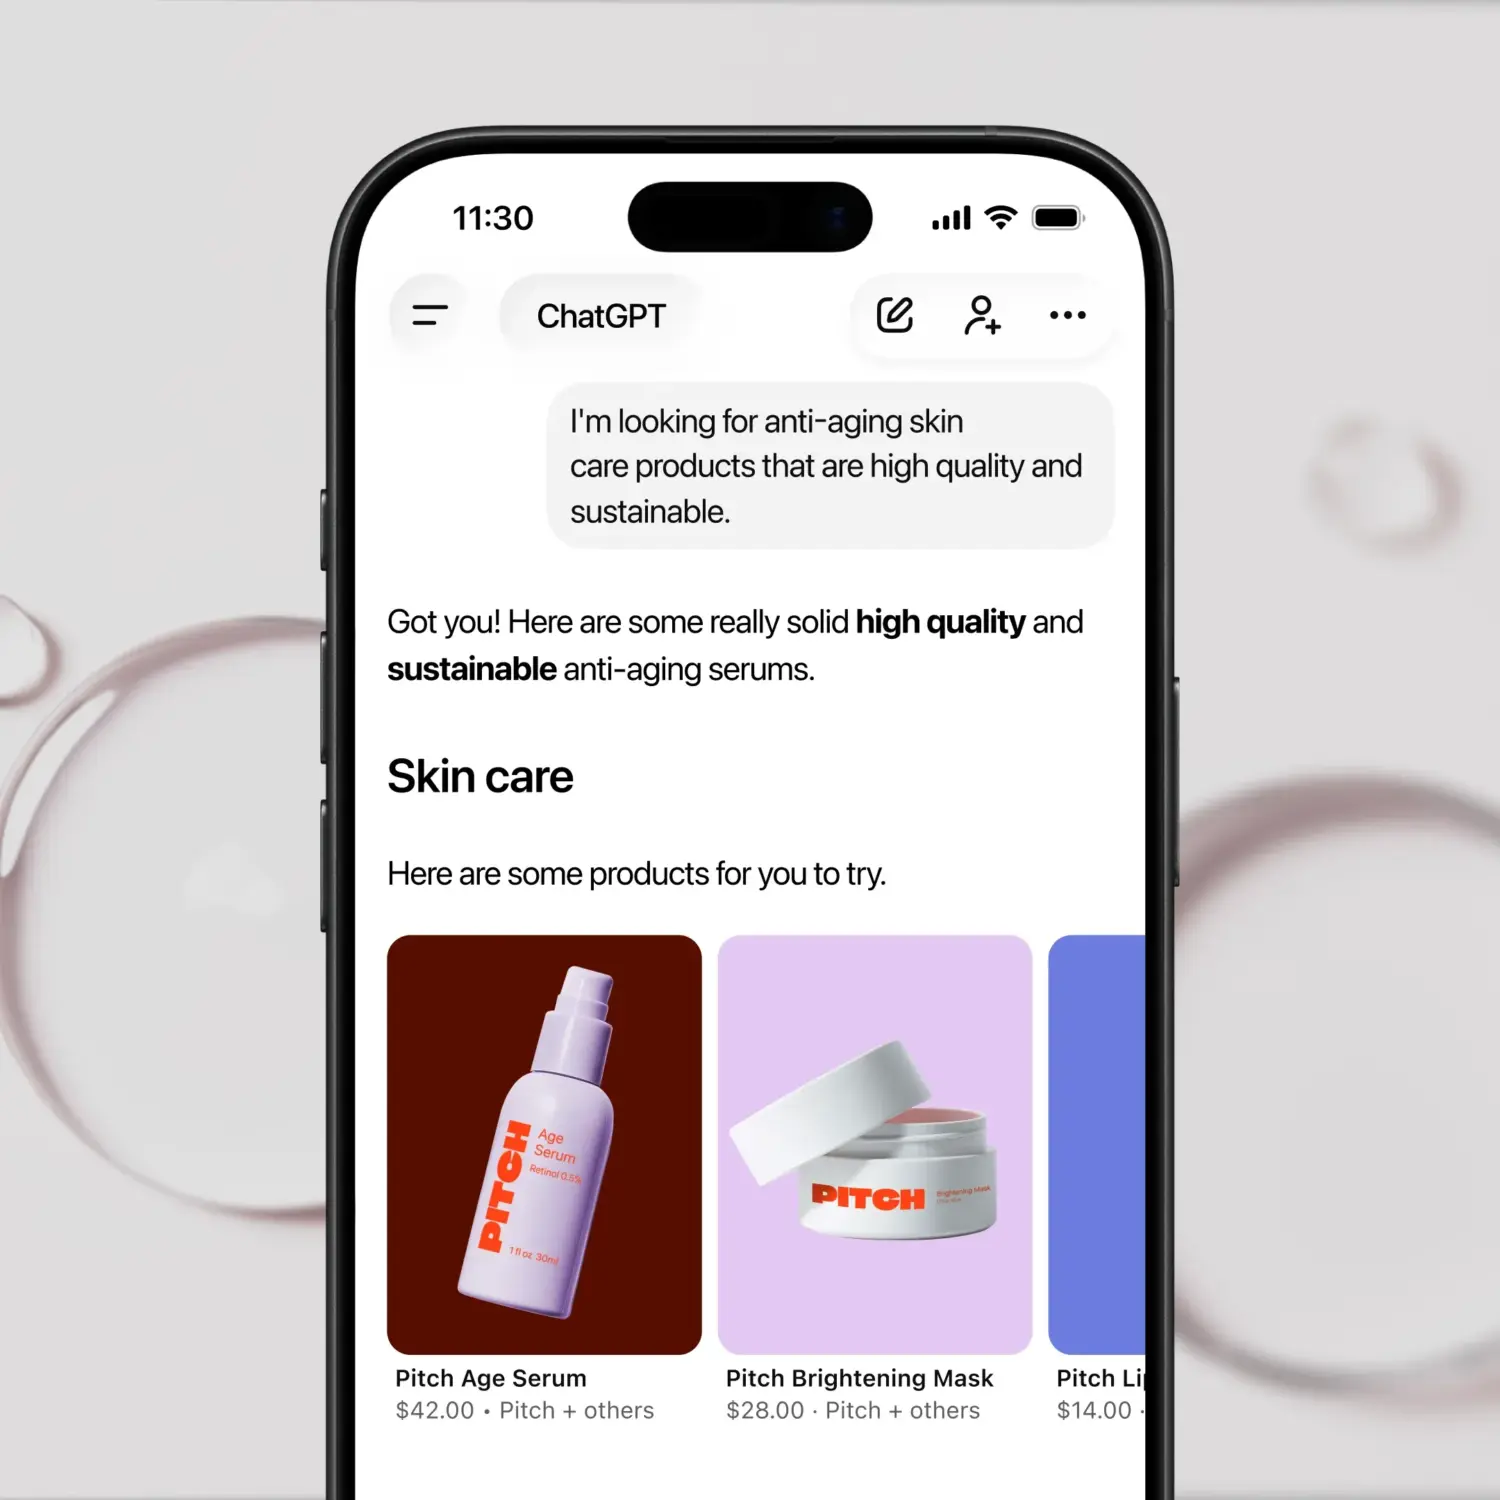
The bigger shift is agentic commerce, where AI agents browse, compare, and buy on a shopper’s behalf. It moved from idea to reality fast. A Morgan Stanley survey found 45% of US consumers had used ChatGPT in the prior month, and Shopify now lets over 1 million of its merchants sell directly inside ChatGPT, Perplexity, and Copilot.
The takeaway is concrete: keep your product data clean and clearly structured, because agents skip products with missing or messy details. On the agent-driven web, clean data becomes a conversion factor of its own.
Short-form video and real customer content build trust faster than polished studio shots, especially for younger shoppers. The lift is measurable: product pages with user-generated content can raise conversions by around 30%, and shoppers who watch a product video are far more likely to add the item to cart. Add a short video and a few customer photos to your top product pages, then watch the add-to-cart rate move.
Shoppers no longer move in a straight line. They discover a product on Instagram, check it on your site, and finish the purchase in the Shop app or in a store. Omnichannel selling meets them on every channel with the same prices, inventory, and offers, so switching channels never breaks the journey.
This pays off because it removes the friction of starting over. A unified cart, shared customer data, and consistent promotions let a shopper buy the moment they are ready, wherever they are. The payoff is real: omnichannel shoppers spend about 16% more per order and carry a 30% higher lifetime value than single-channel shoppers.
The channels worth connecting for a Shopify store:
The practical move is to keep inventory, pricing, and offers in sync across every channel, so the experience feels like one store, not five.
Track three numbers together: conversion rate, AOV, and profit per order. A change that lifts conversion but tanks profit is not a win. A discount can do exactly that.
Give each change 2 to 4 weeks before you judge it, so you have enough data to trust the result. And watch the trade-offs. AOV gains from heavy discounting often shrink your margin more than they grow your sales.
Shopify conversion rate optimization is not a giant overhaul. It is a loop: diagnose where you lose conversions, fix the biggest leak, then measure whether it worked.
Start by finding your weakest funnel stage. For most stores, that is the cart and checkout, where cost surprise drives the most abandonment. Speed, mobile, trust, and a clean checkout fix the foundations. Offers, surfaced with a progress bar and timed around your seasonal campaigns, answer the cost objection at the moment shoppers hesitate.
If offers are where you want to start, a Shopify promotions app lets you run free gifts, bundles, and shipping thresholds together without juggling tools. Pick one or two high-leverage changes, test them properly, and let the results guide the next move.
A new store often starts below the 1.4% average while it builds trust and reviews. That is normal. Focus on the basics first, speed, clear product pages, and an easy checkout, and the rate climbs as shoppers learn to trust you.
Give most changes 2 to 4 weeks. You need enough traffic and orders to tell a real lift from random noise. Big seasonal swings can blur the picture, so compare like-for-like periods where you can.
Both. They raise order size, which is the AOV win everyone talks about. They also raise conversion, because a free shipping threshold or a gift answers the cost objection that drives the most cart abandonment. That is why offers belong in your conversion plan, not just your AOV plan.
Shopify instant checkout means three different things, and the most important one changed in 2026. It can mean buying...

Every click to your product page is a chance to make a sale or lose a customer. A product...

ChatGPT started as a place to draft product copy. Now it does much more. Shopify has turned it into...