Allan Vu is a Digital Marketing expert and the driving force behind BOGOS’s blog content. With a deep understanding of eCommerce and Shopify promotions, he is passionate about helping merchants unlock the full potential of their stores.
At BOGOS, Allan creates valuable, practical content focused on strategies like Free Gifts, Buy X Get Y, product bundles, and upsell offers to empower Shopify sellers to grow their businesses effectively.
Known for his clear, insightful writing, Allan is dedicated to delivering actionable advice that makes a real difference for BOGOS’s readers.
Product bundles can be powerful for upselling and increasing order value. But after creating a bundle, many merchants struggle with a simple question. Is this bundle actually working?
Without clear data, it is hard to tell whether bundles are driving new revenue or simply discounting products that customers would have purchased anyway. Measuring bundle performance allows you to identify successful bundle strategies, optimize pricing, and avoid profit loss. This guide will cover the key Shopify bundle metrics, where to find the relevant reports, and which tools help you analyze bundle performance effectively.
1. Key metrics to track bundle performance on Shopify
1.1 Bundle conversion rate
Bundle conversion rate measures how often visitors who see a bundle actually buy it. This metric can reveal:
Whether the bundle offer is appealing
Whether the pricing and discount are convincing
Whether the bundle placement on the product page or cart page is effective
For example, if a bundle page receives 1,000 views but only generates 20 purchases, the conversion rate is 2%. That may suggest the bundle needs improvement in pricing, composition, or visibility.
Typical e-commerce product page conversion rates often range from 1%to 3%, though this varies by industry and traffic quality. A bundle conversion rate within or above that range usually indicates the offer is reasonably attractive.
1.2 Bundle revenue
Bundle revenue tracks revenue generated specifically from bundle purchases. Merchants typically monitor 2 numbers:
Total revenue from bundles
Percentage of total store revenue coming from bundles
These metrics show the real contribution bundles make to overall store performance. For example:
Bundle revenue: $12,000
Total store revenue: $80,000
Bundle contribution: 15%
This helps answer questions such as:
Are bundles a meaningful revenue driver for the store?
Which bundles generate the most sales?
Should the store invest more in bundle campaigns?
Over time, merchants can also track bundle revenue trends to see whether bundle performance improves after optimizing pricing, placement, or product combinations.
1.3 Average order value (AOV) impact
One of the main reasons merchants create bundles is to increase average order value (AOV). To evaluate this impact, merchants compare:
AOV for orders containing bundles
AOV for orders without bundles
If bundles are working well, orders that include bundles should typically have higher order values and more items. Example comparison:
Metric
Orders with Bundle
Orders without Bundle
Average order value
$78
$52
Items per order
3.1
1.9
This comparison helps merchants understand whether bundles truly encourage customers to purchase more products together. A bundle that increases both AOV and items per order usually indicates a successful upsell strategy.
1.4 Bundle attach rate
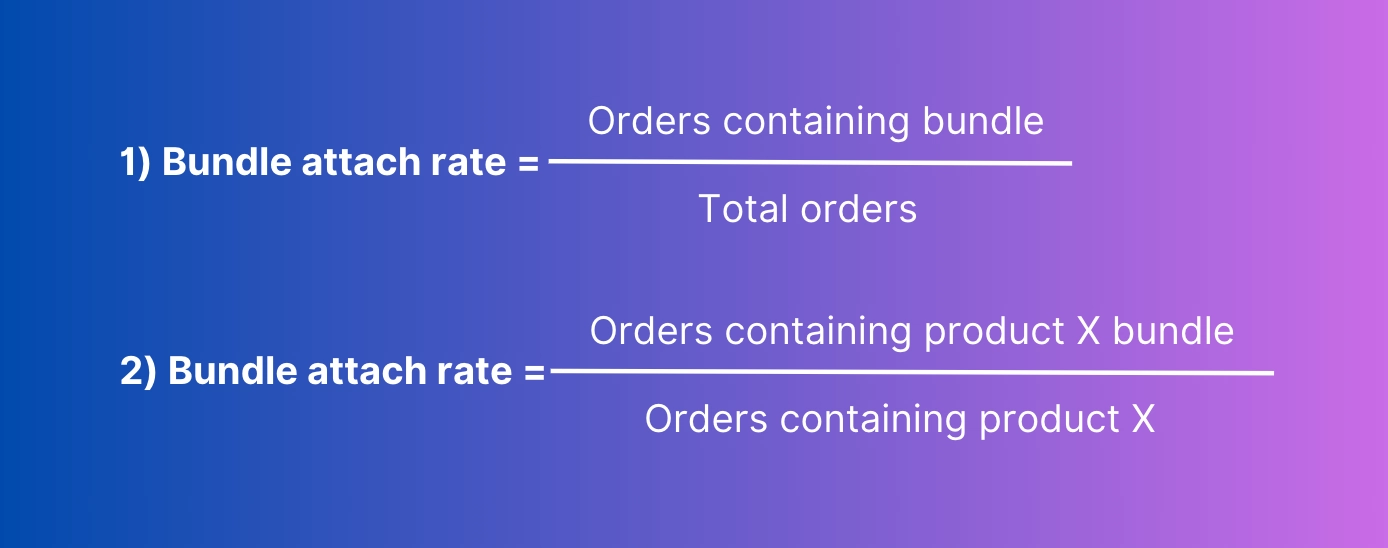
The bundle attach rate measures how frequently a bundle appears in customer orders. It is commonly used to evaluate upsell effectiveness.
Two common formulas are used.
The 2nd formula is particularly useful when a bundle is designed to upsell a specific product. For example:
Orders containing Product A: 500
Orders containing Product A bundle: 120
⇒ Bundle attach rate = 24%
A higher attach rate usually indicates that the bundle offer is relevant and well-positioned in the buying journey.
Attach rate can also reveal:
Whether customers notice the bundle offer
Whether the bundle complements the base product
Whether bundle placement near the add to cart area is effective
1.5 Product cannibalization rate
Not all bundle sales represent new revenue. Sometimes bundles simply replace purchases that would have happened anyway. Product cannibalization analysis helps determine whether bundles create incremental revenue or simply shift sales from individual products.
Merchants often evaluate this by comparing product sales before and after launching a bundle.
Typical approach:
Track single product sales before bundle launch
Track single product sales after bundle launch
Compare bundle sales with any decline in individual product sales
Example scenario:
Product A sold 800 units per month before the bundle launch
After the bundle launch, single product sales drop to 600 units
Bundle sales generate 250 units of Product A
In this case, the bundle may still create net growth, but the merchant should analyze whether discounts are reducing profit unnecessarily.
Cannibalization analysis is especially important for bundles that include best-selling products.
1.6 Bundle profit margin
Revenue growth does not always translate into higher profits. Bundles often rely on discounts, and deep discounts can significantly reduce margins. Bundle profit margin helps merchants evaluate whether bundle campaigns remain financially sustainable.
Basic calculation:
When evaluating bundle profitability, you usually track:
Bundle selling price
Total cost of products in the bundle
Total discount applied
Net profit per bundle order
For example, suppose a bundle is sold for $60, and the total cost of goods for the included products is $35. The store earns $25 profit per bundle order.
Even if bundles increase order volume, the margin should still remain acceptable for the business. Otherwise, higher sales could come at the cost of reduced profitability.
Common bundle performance scenarios and what they mean
Scenario
What it means
Good or bad?
How to improve
High AOV, low conversion rate
The bundle creates large orders, but the offer is too expensive or hard to find for most shoppers.
Mixed. Good for order value, but bad for sales volume.
– Simplify the bundle options- Lower the discount threshold- Move the offer closer to the “Add to Cart” button
High conversion rate, low aov uplift
Customers buy the bundle, but they are just substituting regular purchases rather than buying more items.
Bad. Fails to expand revenue unless your profit margins are exceptionally high.
– Add more complementary items- Create higher-value bundle tiers- Focus on cross-selling instead of just discounting
High attach rate, low bundle revenue
The bundle is frequently purchased, but its low price point limits its overall business impact.
Mixed. Good for customer adoption, but bad for overall revenue growth.
– Bundle higher-priced anchor products- Include more valuable add-ons- Test a slightly higher base price
High bundle revenue, low profit margin
The bundle generates high sales volume, but aggressive discounting is eroding your profits.
Bad. High financial risk; strong sales don’t matter if you lose money.
– Reduce the discount depth- Swap in higher-margin products- Set strict minimum margin targets
High conversion, high cannibalization
The bundle is simply stealing sales from individual products rather than generating new demand.
Bad. Creates an illusion of success while shifting revenue instead of growing it.
– Avoid heavy discounts on existing best-sellers- Bundle slow-moving inventory with popular items- Compare pre- and post-launch sales data closely
Low conversion, low attach rate
Shoppers are ignoring the bundle completely due to poor placement, irrelevant products, or unclear savings.
Bad. The bundle is failing completely and needs a full revamp.
– Test completely new product combinations- Make the financial savings more obvious- Improve bundle visibility on the product page
2. Where to find bundle performance data in Shopify
In most cases, bundle performance data comes from 3 main sources:
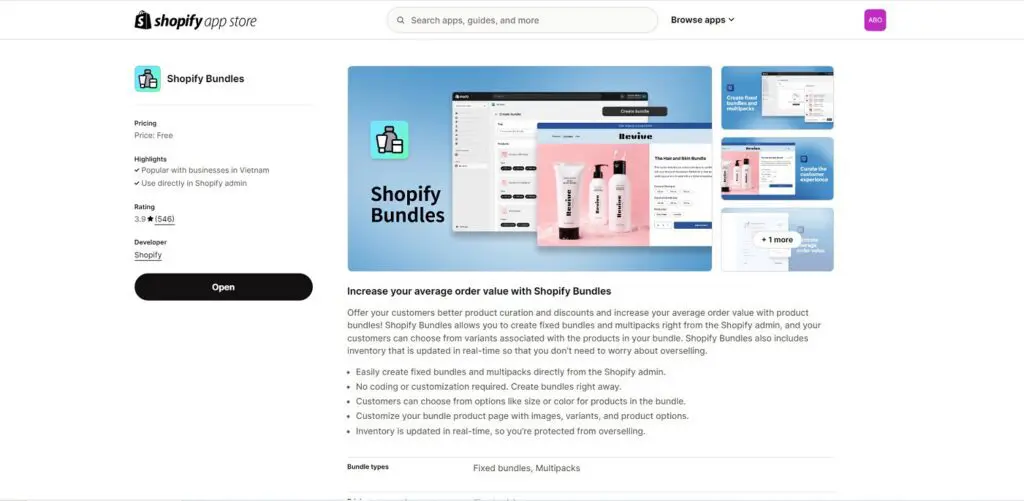
When merchants create bundles using the Shopify Bundles app, Shopify Analytics automatically provides several dedicated bundle reports. If you use third-party apps, Shopify Analytics usually does not display these native bundle reports.
Below are 4 main bundle reports available in Shopify Analytics.
2.1.1 Bundle total sales over time
This report shows the number of orders and total revenue generated from bundles over time.
By default, Shopify displays the data as a line chart, often compared with the previous 30-day period. This visualization makes it easier to identify trends in bundle performance.
Merchants commonly use this report to:
Monitor bundle revenue growth
Identify seasonal changes in bundle demand
Evaluate whether bundle campaigns improve sales over time
For example, if bundle sales increase after placing the bundle widget near the add to cart button, the trend line can confirm whether that change improved performance.
2.1.2 Total sales by bundle
This report shows the net number of bundles sold and total sales generated by each bundle.
The data is usually displayed as a horizontal bar chart, which makes it easy to compare bundle performance at a glance.
This report helps merchants quickly answer questions such as:
Which bundles sell the most
Which bundles generate the highest revenue
Which bundles may need pricing or product adjustments
Many merchants use this report to identify best-selling bundles within the last 30 days and prioritize them in promotions or product page placements.
2.1.3 Total sales by bundle component
This report breaks down bundle performance at the individual product level. Instead of showing bundle sales as a single unit, Shopify lists each product inside the bundle separately and shows:
The number of items sold
The total sales generated by that product within bundles
For example, if a bundle contains shampoo, conditioner, and shower gel, each product will appear as its own row in the report. This insight helps merchants understand:
Which products contribute the most to bundle revenue
Which bundle components customers value most
Whether certain products make a bundle more attractive
These insights are useful when optimizing bundle composition or product combinations.
2.1.4 Bundle component and product comparison
This report compares sales of products bundled with other products versus sales of the same products sold individually.
Shopify usually displays this data in a grouped bar chart, where each product has 2 values:
Sales when the product is purchased as part of a bundle
Sales when the product is purchased individually
This comparison helps merchants determine whether bundles generate additional revenue or simply shift sales from individual products.
For example, if a product sells significantly more through bundles while maintaining stable individual sales, the bundle is likely generating incremental demand. However, if individual product sales drop sharply after bundle launch, it may indicate product cannibalization.
2.2 Shopify bundle apps with built-in analytics
While Shopify’s native analytics mainly focuses on order and product sales, bundle apps help you track how customers interact with bundle offers throughout the buying journey.
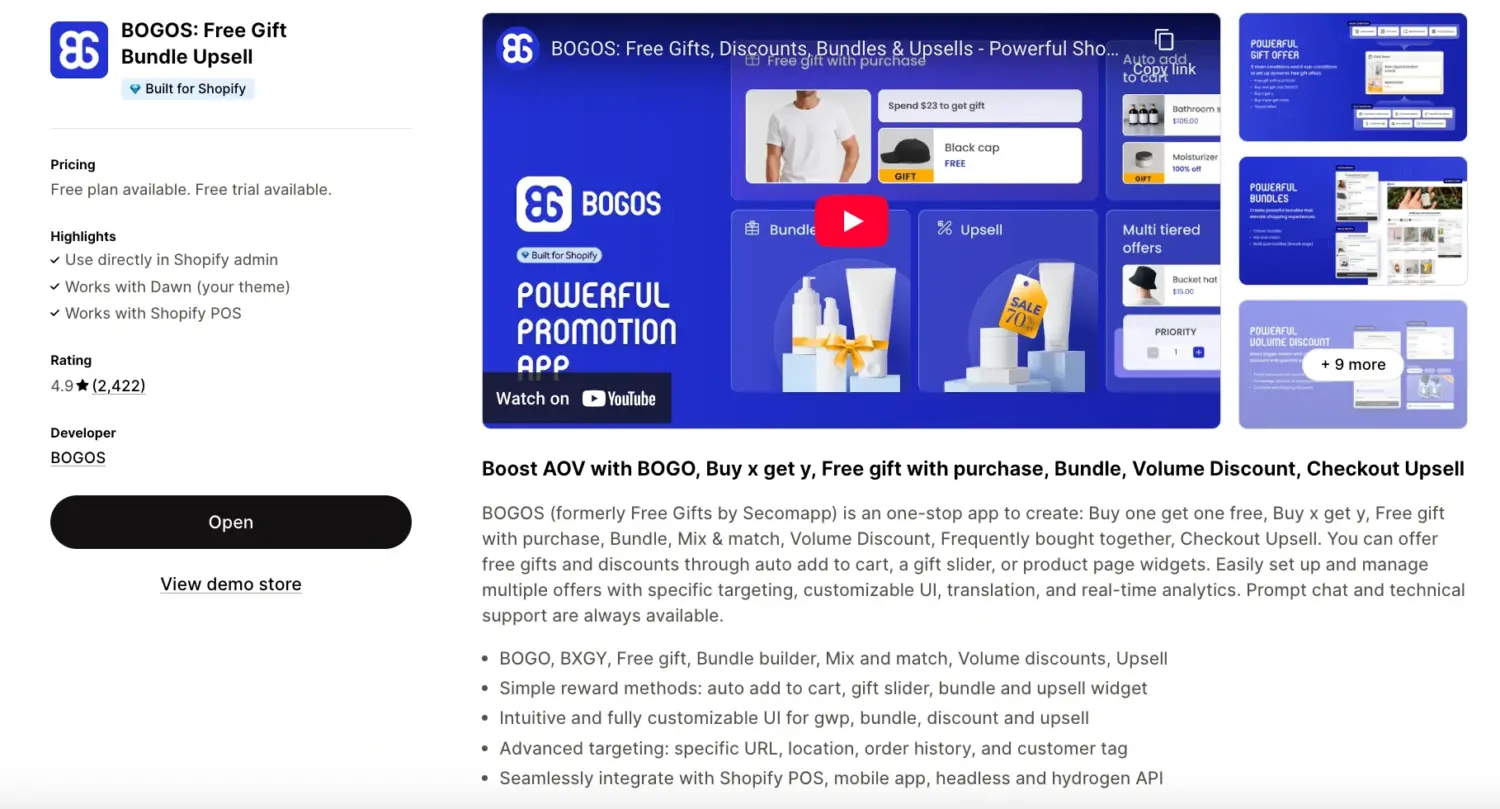
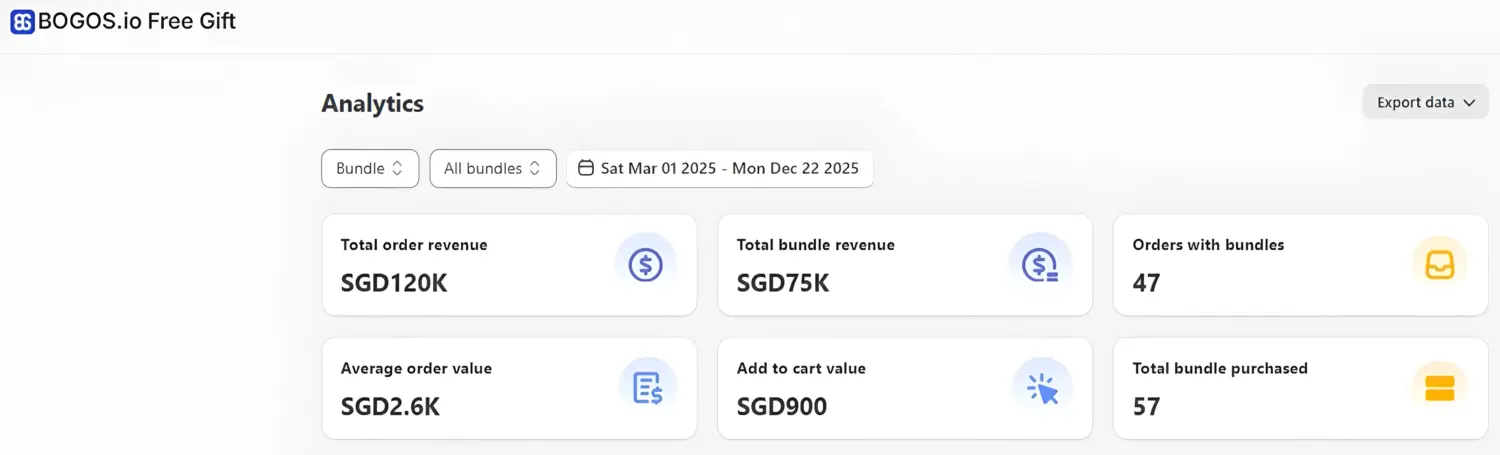
A popular example is BOGOS (5.0 ⭐- 3,400+ users) – one of the most widely used bundle and promotion apps on the Shopify App Store. The app provides a dedicated analytics dashboard that helps merchants monitor bundle performance in real time. Compared to standard Shopify analytics, bundle apps often offer moregranularperformancemetrics tailored to promotional campaigns.
Key bundle metrics:
Total order revenue – the total revenue from orders that include bundles and any other offers.
Total bundle revenue – revenue generated from bundles only.
Orders with bundles – the number of orders that contain bundle offers.
Average order value (AOV) – the average value across all orders during the selected time period.
Add-to-cart value – calculated by dividing total bundle revenue by the number of times bundles were added to the cart.
Total bundles purchased – the total number of bundles successfully purchased.
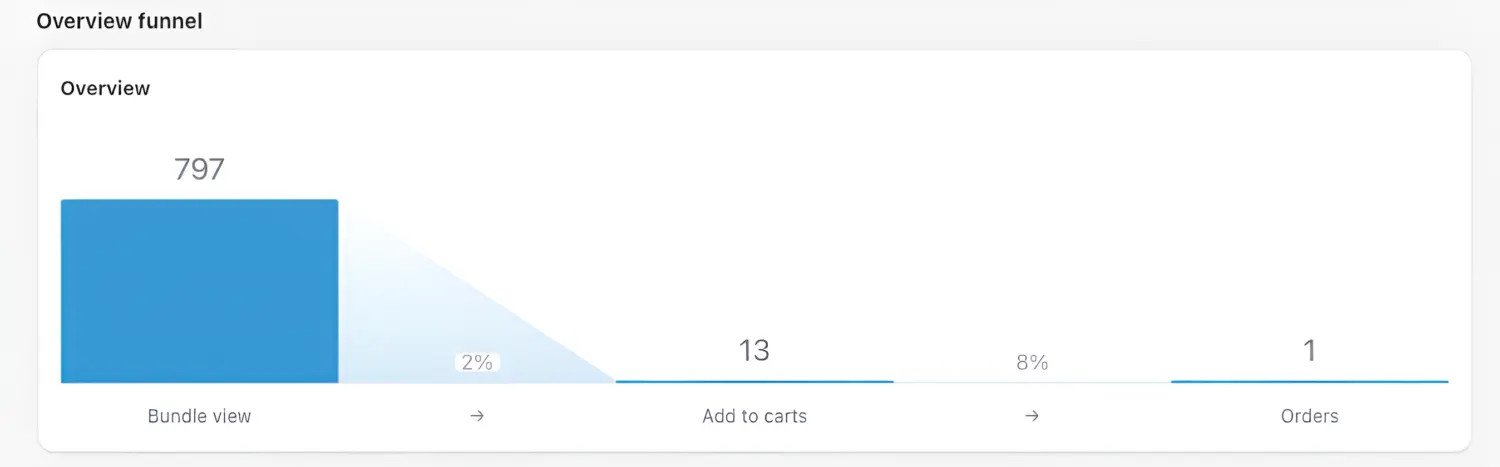
Bundle conversion funnel
This visualizes how customers move through the bundle purchase journey. A typical funnel looks like this:
Bundle view – the total number of times customers viewed the bundle offer.
Add to cart – how many times the bundle was added to the cart.
Orders – the number of completed orders that include the bundle.
By analyzing the conversion rate between each step, merchants can quickly identify where customers drop off in the funnel.
For example:
If bundle views are high but add-to-cart is low, the offer may not be compelling enough.
If add-to-cart is high but orders are low, there might be friction during checkout.
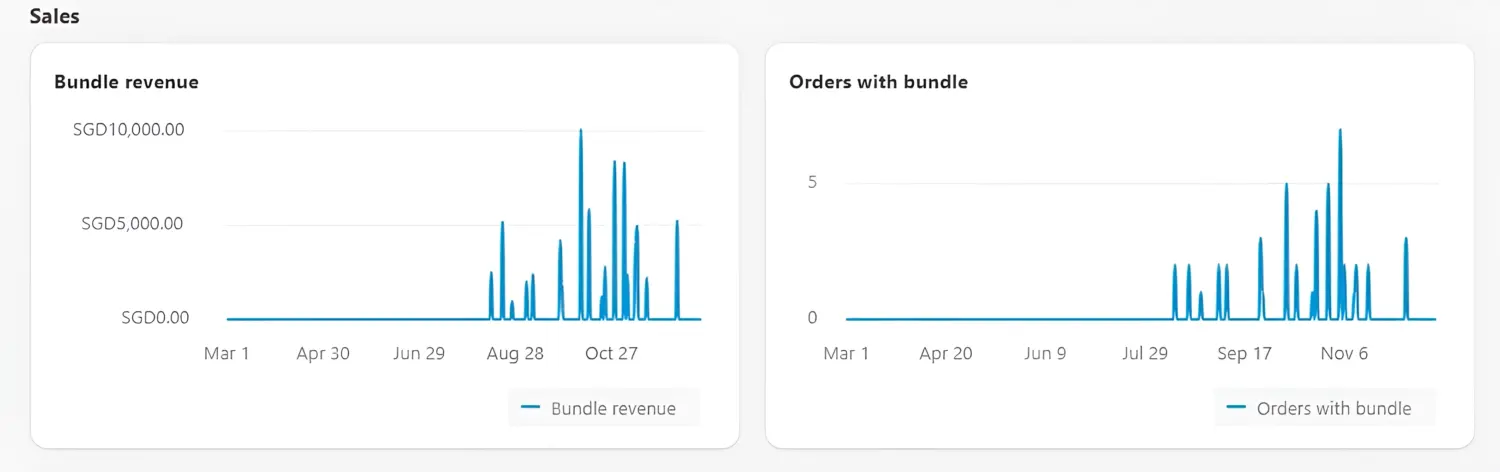
Additional performance insights:
Bundle analytics dashboards also often include supporting reports and visualizations, such as:
Bundle revenue charts showing revenue trends over time
Orders with bundle charts to track bundle purchase trends
Order lists that show which orders include bundle offers and the type of bundle purchased
These insights help merchants continuously optimize their bundle strategy by testing:
bundle pricing
bundle composition
bundle placement on product pages or upsell widgets
Overall, bundle apps with built-in analytics offer a more detailed, actionable view of bundle campaign performance, helping merchants refine their offers and improve conversion rates.
2.3 Profit analytics tools
For larger Shopify stores, bundle performance should be evaluated not only by revenue but also by profitability. A bundle may increase sales but still reduce margins if discounts, product costs, shipping, and ad spend are not considered.
Profit analytics tools help merchants:
Measure bundle contribution to total revenue
Analyze profit margin by product or bundle
Track customer lifetime value (LTV) to see if bundle buyers generate more long-term revenue
Below are 3 popular profit analytics tools used by Shopify merchants.
– Custom analytics dashboards – Multi-source data integration (Shopify, ads, CRM) – Advanced data visualization – Business intelligence reporting
– More complex setup – Higher pricing for advanced features
Data-driven teams needing flexible BI dashboards
~$470–$1000+/month
These tools are especially useful when:
Your store is running multiple marketing channels
You spend significantly on paid advertising
You want to understand true unit economics, not just revenue
3. Tips to improve Shopify bundle performance
Test bundle pricing: Do not assume a bigger discount will always perform better. Try a few price points such as 5%, 10%, or a fixed amount off, then compare conversion rate, AOV, and margin to find the level that lifts revenue without cutting profit too much.
Test bundle composition: The best bundle is usually the one that feels useful, not the one with the most items. Start with products that naturally go together, then test different combinations to see which set gets more adds and fewer abandoned carts.
Highlight savings clearly: If customers cannot see the value fast, the bundle is easier to ignore. Show the original total price, the bundle price, and the amount saved in a simple format so the benefit is obvious at a glance.
Place the bundle near the add to cart area: A good bundle offer should appear when buying intent is already high. Put it close to the product price, variant selector, or add-to-cart button so shoppers can evaluate the offer without extra steps.
Use post-purchase bundles: Some shoppers do not want to make all decisions before checkout. A post-purchase bundle can work well because the main order is already complete, so the shopper is more open to adding another relevant offer with less friction.
4. Bottom line
In short, bundles only work when you measure them properly. Track metrics like conversion rate, AOV impact, and bundle revenue to see whether your bundles actually increase sales or just add discounts. Once you have the data, it becomes much easier to optimize pricing, product combinations, and placement.
5. FAQs
Does Shopify Analytics natively track bundle performance?
Yes. If you use the native Shopify Bundles app, you get specific reports, such as bundle total sales and sales by bundle component. If you use a third-party app, you usually need to check its analytics dashboard.
Can Google Analytics 4 track Shopify bundle views?
Yes, but only if the bundle is created as a manual product (separate SKU) in Shopify. If the bundle is generated by a third-party bundle app, GA4 usually tracks the individual products instead of the bundle itself.
Is a very high bundle conversion rate always a good sign?
No. If your bundle conversion rate is extremely high but your overall store profit drops, your discount is probably too deep. You always need to evaluate conversion rate alongside your net profit margin.
Can I track bundle widget clicks in standard Shopify reports?
No. Standard Shopify Analytics focuses entirely on completed orders and revenue. To track behavior metrics like bundle widget views or clicks, you need either a bundle app with built-in analytics, like BOGOS, or an external tracking setup.
Is bundle attach rate the same as bundle conversion rate?
No. Conversion rate measures the percentage of shoppers who bought the bundle after viewing it. Attach rate measures the percentage of total store orders that included a bundle, which is a better way to judge the overall impact of your upsell strategy.